
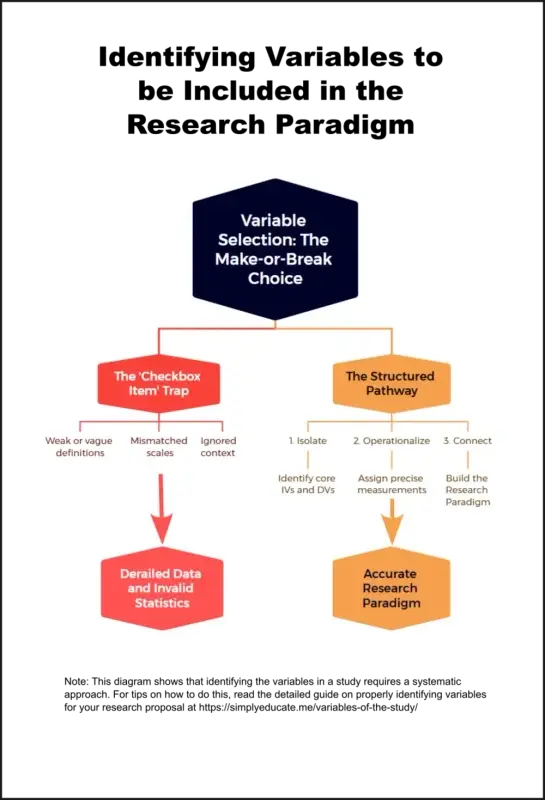
Choosing the right variables of the study is the ultimate make-or-break moment for any quantitative research design. While many researchers treat them as a simple checkbox item, misunderstanding how to isolate, define, and connect your variables will completely derail your data collection and invalidate your statistical analysis.
Read on to be thoroughly familiar with the Independent Variable – Dependent Variable (IV-DV) model, discover how to operationalize your concepts with precision, and learn how to build a research paradigm that accurately captures the phenomenon you are investigating.
Table of Contents
Developing a dependable conceptual framework is one of the most critical steps in structuring a quantitative thesis or dissertation.
As a supporting piece to our comprehensive Conceptual Framework Guide, this article focuses on a question that frequently stalls graduate and advanced undergraduate researchers: How do you choose your study variables, and which ones belong in your research paradigm?
When designing a research paradigm—the visual map of your conceptual framework—correctly isolating and classifying your variables dictates everything from your data collection tools to your statistical analysis. Accurate data analysis requires properly-structured statistical research questions (see Three Tips on How to Write Good Statistical Questions) .
This guide addresses the common pitfalls of variable selection and provides concrete examples to help you align your variables with your overall research design.
Write notes as you go along as this is an important part of research proposal preparation.
The Challenge of Multi-Variable Research Designs
In advanced graduate research, particularly within fields like educational administration, public policy, or behavioral sciences, research problems rarely involve just two isolated factors. Instead, you are often dealing with complex, multi-layered phenomena that require multivariate statistical analysis.
If your dissertation or thesis plans to utilize advanced statistical techniques, your choice of variables must be highly precise. These tests include:
- Multiple Regression Analysis: Used to predict the value of a dependent variable based on two or more independent variables.
- Factor Analysis: Used to reduce a large number of variables into a fewer number of overarching factors or clusters.
- Structural Equation Modeling (SEM): Used to assess complex, multi-variable causal relationships and pathways simultaneously.
Because your choice of statistical tests depends entirely on the nature of your data, your variables must be clearly identified and operationally defined before you begin data gathering.
Quantitative Data Analysis: Simplified
Struggling to choose the right statistical test for your thesis or research project?
This 39-page mini eBook is your clear, practical guide to matching your data with the correct statistical test—without the jargon. Written by a researcher for researchers, it explains key concepts in simple terms, helps you avoid common data pitfalls, and gives you the confidence to analyze your results accurately.
Perfect for graduate students, thesis writers, and early-career researchers who want to save time, avoid mistakes, and make their research count.
Grounding Your Variables in a Comprehensive Review of Literature About Your Topic
Your research paradigm does not exist in a vacuum. It appears later in the introductory chapters of your paper because it is the visual culmination of your literature synthesis.
Selecting your variables requires two distinct steps:
- A Thorough Review of Related Literature (RRL): You must understand how previous scholars have defined, categorized, and measured the concepts you are investigating. The literature provides the theoretical justification for why Variable A might influence Variable B.
- A Clear, Specialised Thesis Statement: Your research must be bounded by your specific field of study. For instance, a doctoral student in educational administration should focus on variables that influence institutional health, leadership efficacy, policy implementation, or academic achievement.
5 Examples of Aligning Research Titles with Variables
A well-formulated research title should explicitly state or strongly imply the core research variables under investigation. To demonstrate how to extract variables from a research concept, consider these five contemporary institutional and educational topics:
1. Efficacy of Peer Supervision Models in Faculty Development
- Variables: Type of peer supervision model (independent); faculty teaching efficacy or collaboration metrics (dependent).
2. Factors Affecting the Impact of Professional Development Programs on Teachers’ Instructional Performance
- Variables: Institutional support, program duration, and content relevance (independent factors); teachers’ instructional performance metrics (dependent).
3. Predictors of Student Self-Efficacy in Modern Elementary Education
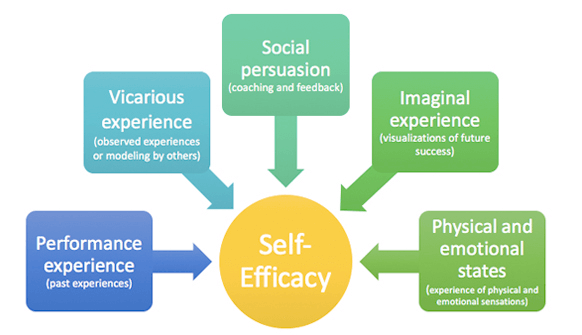
- Variables: Sources of self-efficacy—such as mastery experiences, vicarious experiences, and social persuasion (independent); student self-efficacy scores (dependent).
4. Classroom Environment Factors Affecting Students’ Academic Achievement
- Variables: Physical environment, class size, and teacher-student ratio (independent); standardized test scores or GPA (dependent).
5. Determinants of Effective Information Technology Integration in Hybrid Classrooms
- Variables: Technological infrastructure and teacher digital literacy (independent); rate or quality of IT integration (dependent).
Levels of Measurement and Statistical Compatibility
For your research paradigm to translate into a functional data analysis plan, every variable must be measurable.
How you measure a variable determines its scale of measurement, which directly controls the statistical techniques available to you.
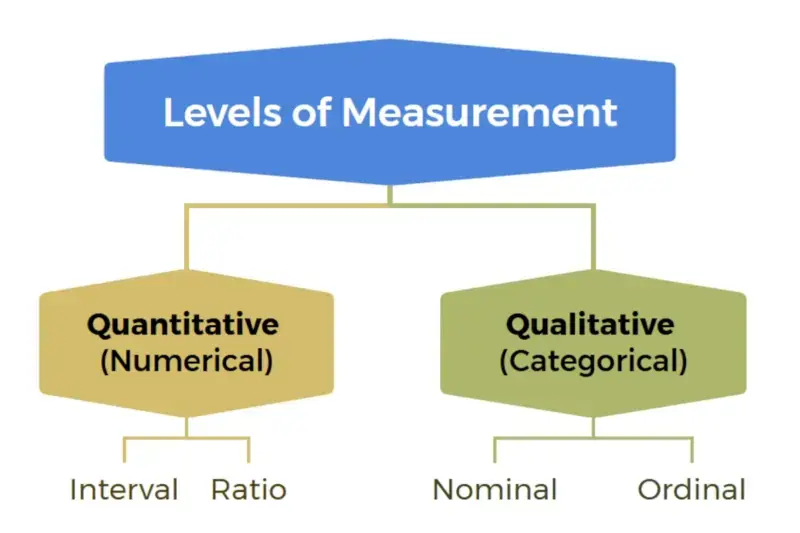
- Nominal: Categorical data with no inherent ranking or numerical value (e.g., gender, school district, department type).
- Ordinal: Categorical data with a clear, logical order, but the intervals between points are unequal or unknown (e.g., Likert scales measuring agreement, socioeconomic status tiers).
- Interval: Numerical data with equal intervals between points, but no true zero point (e.g., standardized test scores, temperature in Celsius).
- Ratio: Numerical data with equal intervals and a true absolute zero point, allowing for ratio comparisons (e.g., years of teaching experience, school budget allocation, student dropout rates).
Take Your Data Analysis Further!
For a more detailed explanation of these measurement scales and additional examples and a quiz to check your understanding, visit my post: Four Essential Scales of Measurement in Statistics Every Student Should Know.
Read the Full Guide →For example, running a multiple linear regression requires a continuous dependent variable (interval or ratio), meaning your paradigm must reflect measurable, quantitative outcomes.
Case Study: Applying Self-Efficacy Theory to a Paradigm
To illustrate how theory shapes your variables, let us look at Albert Bandura’s Self-Efficacy Theory. Bandura posits that an individual’s belief in their ability to succeed at a task is driven by specific informational sources.
When mapping this into a research paradigm, the theoretical components translate directly into measurable independent variables that act upon a primary dependent variable:
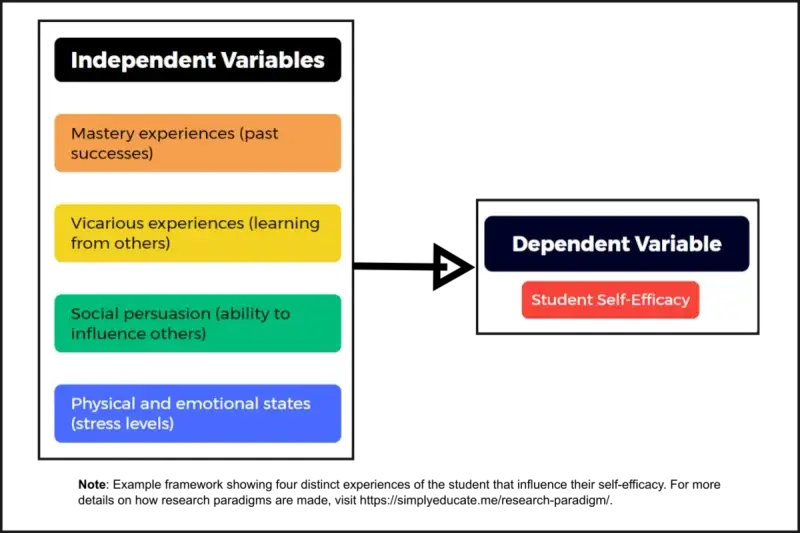
In this framework, the four distinct experiences serve as the predictors (independent variables) of student self-efficacy (dependent variable).
By measuring these distinct factors among your target population, you can use multivariate analysis such as multiple regression analysis to see which specific experience has the most significant statistical impact on overall student self-efficacy.
Differentiating Independent and Dependent Variables and Their Contextual Roles: Moderating, Mediating, Confounding, and Control Variables
Refining your framework requires a solid operational understanding of how your variables interact. Clearly distinguish the relationship between independent and dependent variables, and determine whether your research requires moderating or mediating variables.
The foundational paradigm of a research study typically consists of independent and dependent variables. However, as a phenomenon is examined more deeply through advanced research, these frameworks become increasingly complex.
Consequently, this section likewise defines moderating, mediating, confounding, and control variables, as they are essential for evaluating the intricate relationships inherent in complex phenomena.
Let’s define each concept on variables to avoid confusion.
Independent Variables (IV)
The independent variable is the presumed cause, antecedent, or predictor. It is the variable you manipulate, select, or measure to observe its effects on another factor.
Dependent Variables (DV)
The dependent variable is the outcome, effect, or criterion. It is the variable that changes or varies in response to the conditions or changes in the independent variables.
Note: The Fluidity of Variables
It is vital to note that a variable is not inherently independent or dependent on its own; its classification is strictly determined by the context of your research question.
For example, consider the variable “Teachers’ Instructional Performance”:
- In a study evaluating the impact of an administrative coaching program, Teachers’ Instructional Performance serves as the dependent variable (the outcome being influenced).
- In a study evaluating how teacher behavior influences student graduation rates, Teachers’ Instructional Performance shifts to become an independent variable (the factor causing the influence).
Moderating Variable
A moderating variable is a factor that changes the strength or direction of the relationship between an independent variable and a dependent variable. It acts as a modifier, determining under what specific conditions, or for whom, an effect will occur.
Here are points to bear in mind about a moderating variable with an example:
- Explains when, for whom, or under what conditions a relationship holds true.
- Affects the strength or direction of the relationship between the independent and dependent variables, but does not sit on the causal pathway.
- Example: Age or gender might change how strongly stress impacts a person’s health, making age or gender the moderator.
Mediating Variable
- Explains the how or why behind a relationship between an independent variable and a dependent variable.
- Sits directly in the causal chain between the two variables.
- Example: Exercise ((X)) reduces stress (Mediator), which in turn improves academic performance ((Y))
A moderating variable is a factor that influences the strength, direction, or nature of the relationship between an independent variable (IV) and a dependent variable (DV). Instead of explaining why a relationship exists, a moderator answers the questions of “when” or “for whom” a specific effect holds true, essentially acting as a contextual switch that alters the outcome depending on its value or category.
In contrast, a mediating variable explains the underlying mechanism or pathway through which the independent variable influences the dependent variable. It functions as an intermediary stepping stone in a causal chain, showing how or why an input variable leads to a specific output, where the independent variable first changes the mediator, and the mediator subsequently changes the dependent variable.
Key Differences Between Moderators and Mediators
- Core Function: A moderator alters the intensity or direction of an existing relationship between an IV and a DV, whereas a mediator explains the underlying process or internal mechanism that links the IV to the DV.
- Causal Sequencing: A moderator does not depend on the independent variable and is typically present before the interaction occurs, while a mediator is a direct causal consequence of the independent variable and must change after the IV changes.
- The Core Question Answered: A moderator addresses “When?” or “For whom?” a relationship exists (e.g., Does this leadership style improve teacher performance only for veteran teachers, but not for novices?). A mediator addresses “How?” or “Why?” a relationship exists (e.g., Does a professional development program improve performance because it first increases a teacher’s digital literacy?).
- Statistical Visualization: In a research paradigm, a moderator is drawn as an arrow pointing directly at the relationship line connecting the IV and DV. A mediator is placed between the IV and DV, with directional paths traveling through it.
Confounding Variables
A confounding variable (or confounder) is an unmeasured third variable that correlates with both the independent variable and the dependent variable, falsely implying a direct causal link between them.
The video below explains clearly how this works.
Because it introduces bias, failing to account for a confounder can lead you to see a relationship that does not exist or miss a relationship that does.
Control Variables
A control variable is any factor that a researcher intentionally keeps constant, measures, or statistically accounts for during an experiment or study to isolate the true relationship between the independent and dependent variables. It is not the primary variable of interest, but failing to control it would ruin the internal validity of your research.
How it Relates to Other Variables
The easiest way to understand how a control variable relates to moderators, mediators, and confounders is to look at what happens to the variable during your research design.
| Variable Type | Relationship to the Causal Chain | What the Researcher Does with It |
|---|---|---|
| Control Variable | An extraneous variable that could alter the results if left alone. | Neutralized: Held constant or statistically removed so it cannot interfere. |
| Confounding Variable | An uncontrolled third variable that ruins the data by correlating with both cause and effect. | Neglected: Left unmeasured, resulting in a flawed or misleading conclusion. |
| Moderating Variable | A variable that alters the strength or direction of the relationship based on its value. | Highlighted: Explicitly measured to see when or for whom an effect changes. |
| Mediating Variable | The intermediate step or underlying mechanism through which the cause creates the effect. | Highlighted: Explicitly measured to explain how or why an effect happens. |
The Deep Connection: Turning a Confounder into a Control
A confounding variable and a control variable are often the exact same entity—the only difference is how you handle it.
- If you ignore a third variable (like temperature in the ice cream and drowning study), it remains a confounder that corrupts your data.
- If you measure it and account for it (e.g., by only studying drowning rates on days that are exactly 30°C, or by using statistical software to strip out the effect of temperature), you have successfully turned that confounder into a control variable.
Distinct from Moderators and Mediators
Unlike confounders, you never want to turn a moderator or mediator into a control variable:
- If you control for a moderator (e.g., locking your study to only examine 20-year-olds), you lose the ability to see how age changes the relationship.
- If you control for a mediator, you accidentally erase the actual pathway of the effect, making it look like your independent variable does nothing at all (a mistake known as overcontrolling bias).
Next Steps: Mapping Your Framework
As you finalize the elements of your research design, review your tentative research titles and specific problems. Isolate your predictors from your outcomes, ensure they can be measured at the appropriate nominal, ordinal, interval, or ratio levels, and begin sketching the directional arrows of your paradigm.
🚀 Ready to map out your study?
Jump into our FREE Quick Conceptual Framework Builder App right on this page and start connecting your variables instantly.
To see how these variables integrate into a complete, visual schematic for your thesis or dissertation proposal, read our main article: Conceptual Framework Guide.
Frequently Asked Questions (FAQs)
What is the difference between an independent variable (IV) and a dependent variable (DV)?
In an IV-DV model, the Independent Variable is the presumed cause, antecedent, or predictor that you select or manipulate. The Dependent Variable is the presumed effect, outcome, or criterion. Put simply, the IV is the input, and the DV is the output or behavior you are trying to observe, measure, and explain.
Can a variable be both independent and dependent in the same study?
Yes, but typically only in advanced research designs like path analysis or Structural Equation Modeling (SEM). When a variable acts as a stepping stone—where it is influenced by an IV and, in turn, influences a DV—it is called a mediating variable. However, within a basic, standard IV-DV paradigm, a single variable must be clearly categorized as one or the other to keep your primary hypotheses testable.
How do I know if my variables are ready for data collection?
Your variables are ready only when they are operationalized. This means you have moved past abstract conceptual definitions and have assigned them a concrete method of measurement. You must know exactly what tool will measure them (e.g., a standardized psychometric scale, institutional records) and their precise level of measurement (nominal, ordinal, interval, or ratio).
How many independent variables should I include in my research paradigm?
There is no magic number, but your selection must be justified by your Review of Related Literature (RRL). For a graduate-level thesis using multivariate statistics (like multiple regression), it is common to have 3 to 5 independent variables or sub-factors predicting a single primary dependent variable. Avoid adding variables “just because”; every path in your paradigm must correspond to a specific research question (Statement of the Problem).
What happens if I choose the wrong level of measurement for my variables?
Choosing the wrong level of measurement will invalidate your statistical analysis. For example, if you measure your dependent variable using a nominal scale (e.g., “Pass” or “Fail” categories) but plan to run a standard Multiple Linear Regression (which requires a continuous, interval/ratio DV), your statistical software will either reject the data or produce mathematically meaningless results. Always align your measurement scale with your intended statistical test before printing your questionnaires.
What is the difference between a control variable and a confounding factor?
Both terms deal with variables outside your primary IV-DV relationship, but they are handled differently by researchers:
Control Variables: These are extraneous factors that you actively choose to measure and hold constant (or statistically account for) because they could influence your dependent variable. By “controlling” them, you isolate the true effect of your independent variable.
Confounding Factors: These are unmeasured or hidden variables that correlate with both your independent and dependent variables. If left ignored, a confounding factor can trick you into seeing a causal relationship between your IV and DV that does not actually exist.
How should I handle demographic characteristics (like age, gender, or organizational position) within an IV-DV paradigm?
Demographic characteristics can be integrated into your quantitative research design in one of three ways, depending on your Statement of the Problem (SOP):
As Control Variables or Covariates: If your primary focus is seeing how an educational program (IV) impacts test scores (DV), you might collect data on age or position simply to mathematically remove their influence during your regression analysis. This ensures your findings apply universally across groups.
As Moderating Variables: If you suspect that a certain professional development program (IV) significantly boosts performance (DV) for new teachers but has little to no impact on veteran administrators, you are treating experience or position as a moderator. It changes the strength or direction of the relationship between your IV and DV.
As Secondary Independent Variables: If your research questions explicitly ask, “Is there a significant difference in teacher performance when grouped according to gender or age?”, you are treating those demographics as categorical independent variables. You will use statistical tests like Independent Samples t-tests or ANOVA to compare the mean scores of those distinct demographic groups.
Ready to Build Your Complete Research Blueprint?
Don’t let your variables sit in isolation. Learn conceptual modeling and be prepared to justify your research direction to your defense panel.
Read Our Ultimate Guide to Developing a Conceptual Framework →
References
Bandura, A. (1988). Organisational applications of social cognitive theory. Australian Journal of management, 13(2), 275-302.
LaRocca, B. (2017). Self-efficacy tookit. Retrieved on September 24, 2018 from https://www.transformingeducation.org/self-efficacy-toolkit/
© Simplyeducate.me | P. A. Regoniel
Hello, My name is Stephen! I am a family practice Doctor of 35 years with the enlightening and frightening realization; many people do not know how to discern fact from fiction.
I stumbled upon your article 08/18/2013 and would like to offer you what I have discovered as to how best to distinguish fact from fiction with complete clarity!
All you have to do is turn off your human and anything in and everything it humans people create is fiction.
Humans are the only creatures who can create so everything that we create re-create co-create is fiction, magic, manipulation, and unfortunately, virtual reality made solid.
You can think of this as do re mi is the anything and everything of the universe.
People then take all of that and capture it into mathematics 1 2 3. Then we take mathematics and try to turn it into words ABC.
For example, the word car is a loaded word because you have to define what is a car vs. what is not a car vs. all of the billions of variations of cars.
I discovered pain; the word is tragically misunderstood by almost all of the worlds medical doctors.
Pain is muscle, my, mental, emotional, spiritual, situational resolved with 10 combined therapies. Most importantly every muscle cell, myofibril requires force of release stretching, massaging, spinal unwinding, and most importantly acupuncture and hypodermic intramuscular stimulating needling.
In 1940 a group of orthopedic surgeons betrayed humanity by a picture professing bone-on-bone with a godlike belief that they could fix what God created with knives bone saws amputations auto-parts and glue. Joint replacements nerve repair spinal fusions any procedure with a knife is always wrong to treat stress and strain pain.
The world orthopedic surgeons have carte blanche, immunity, impunity to ritualistic use bone saws amputating living tissue fixing God’s creation with handtools bone saws and glue. Glue! Glue! I believed at one time that it was possible for people to use glue and fix the human body. Now that I know fact vs. fiction it is inconceivable that the whole world now believes in vampires requiring the corpse to be exhumed hearts removed, burned in the city square, and a stake placed in the body to hold him down, so they do not move out of the grave.
Pain is a feeling from within all senses from within is the truth. You treat people with pain with compassion, and their suffering will dissipate just like mother nature intended it to be.
Pain is not anything else, for example, joint pain, nerve pain, arthritis, rheumatism, bone-on-bone, joints wearing out, cartilage, migraine, bursitis, fibromyalgia, or anything derived from a picture or blood test.
The pain everyone experiences from within are TRUTH – The universe is made of materials forces, and energies frequencies so do re mi! To the trained ear if a musician misses one note in an entire sonata, they will catch it. Less than masterful years will not. It is impossible to full mother nature and mathematics because if the numbers do not add up or match it is fiction.like the sun, the moon
Anything that we construct into words is all manipulated thus fictional.
Everything that people take away from everything and anything that is natural becomes contaminated.
So what you believe? If it did not fit mathematical models, it is fiction.
If it did not fit the five elements or steps within of scientific methodology, it is fiction.
First have an indelible reference grounded in do re mi, 1 2 3, ABC = Cause-effect, problem-solution = resolution Repeatable to 99.999% of the time.
That’s great reflection. Thanks for the feedback!