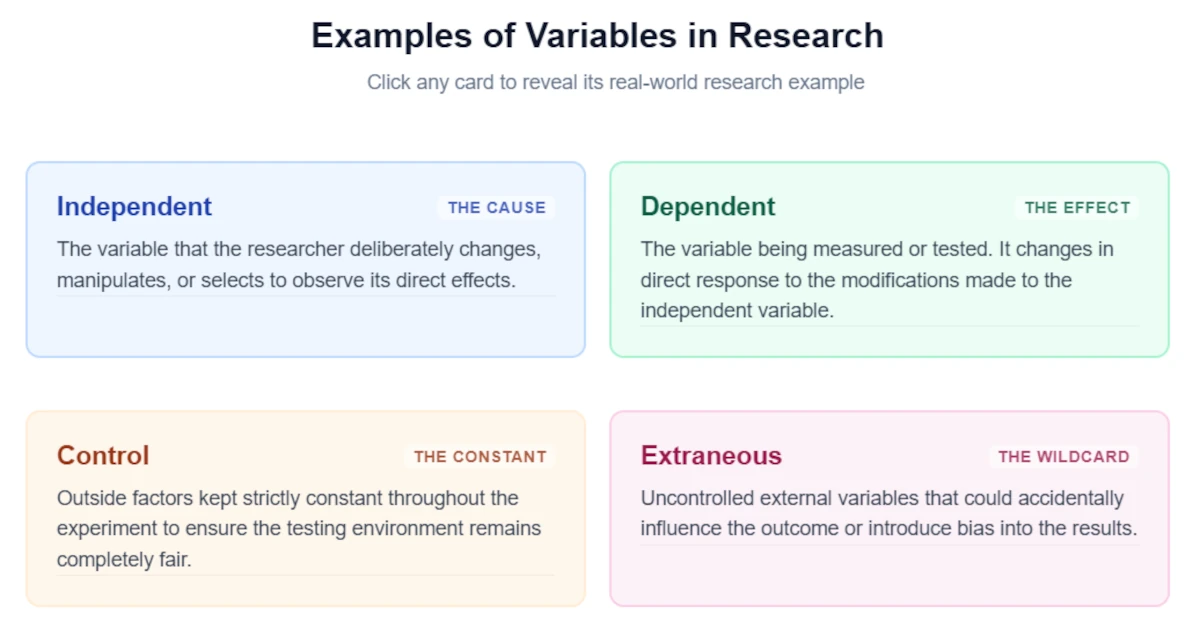
Looking for examples of variables in research? Discover clear definitions, independent and dependent types, and 6 real-world phenomena to guide your thesis.
Watch the video above to get a grasp of the key contents of this article or you may go read the article below if that suits you best. You may tap on the interactive card below to see specific examples of variables.
Table of Contents
Introduction
Variables are the building blocks of any research study, yet they are often one of the trickiest concepts for students and researchers to master—especially when dealing with quantitative data analysis.
Failing to grasp what variables mean—or confusing independent and dependent variables as you proceed into statistics—can stall a thesis proposal and complicate your conceptual framework.
To make this concept concrete, the guide below breaks down how abstract phenomena translate into measurable, data-driven variables using clear, real-world examples.
What are Variables?
Variables are those simplified portions of the complex phenomena that you intend to study. The word variable is derived from the root word “vary,” meaning, changing in amount, volume, number, form, nature, or type. These variables should be measurable, i.e., they can be counted or subjected to a scale.
By breaking down abstract concepts into tangible metrics, researchers can isolate specific elements to observe how they interact in the real world. Ultimately, this operationalization turns vague observations into rigorous data that form the backbone of sound empirical investigation.
The next section provides examples of variables related to climate change, academic performance, crime, fish kill, crop growth, and how content goes viral. Note that the variables in these phenomena can be measured, except the last one, where a bit more work is required.
Examples of Variables in Research: 6 Phenomena
The following are examples of phenomena from a global to a local perspective. The corresponding list of variables is given to illustrate how complex phenomena can be broken down into manageable pieces for better understanding and to subject the phenomena to research.
Phenomenon 1: Climate change
Examples of variables related to climate change:
- sea level
- temperature
- the amount of carbon emission
- the amount of rainfall
Here is an explanation of why each of these climate change factors functions as a variable in research, along with the specific units and methods used to measure them:
1. Sea Level
- Why it is a variable: Sea level changes dynamically over time due to factors like thermal expansion (warming oceans) and the melting of land-based ice sheets and glaciers. Because it fluctuates across different coastal regions and decades, it serves as a measurable indicator of climate shifts.
- How it is measured: Measured in millimeters or centimeters relative to a fixed land-based vertical datum, often using satellite radar altimetry (from space) and tide gauge stations deployed along coastlines.
2. Temperature
- Why it is a variable: Atmospheric and ocean temperatures vary constantly across different geographical locations, seasons, and time periods, making them critical for tracking global warming trends.
- How it is measured: Measured in degrees Celsius (°C), Fahrenheit (°F), or Kelvin (K). In research settings, it is recorded using standardized weather station thermometers, oceanographic buoys, and satellite infrared sensors.
3. The Amount of Carbon Emission
- Why it is a variable: Carbon emissions (such as carbon dioxide released from fossil fuel combustion and industrial processes) fluctuate significantly depending on geographic region, economic activity, and policy interventions.
- How it is measured: Quantified in metric tons or gigatons of CO2 equivalent (GtCO2e) per year or region. Researchers calculate this using fuel consumption data, industrial output metrics, and atmospheric gas concentration measurements taken via greenhouse gas monitoring towers and satellites.
4. The Amount of Rainfall
- Why it is a variable: Precipitation levels vary drastically by region, season, and year, impacting ecosystems, agriculture, and hydrological cycles.
- How it is measured: Measured in millimeters or inches of liquid water depth over a specific time period (e.g., daily, monthly, or annually). This is captured using rain gauges, weather radar systems, and satellite precipitation tracking.
Phenomenon 2: Crime and violence in the streets
Examples of variables related to crime and violence:
- number of robberies
- number of attempted murders
- head count of incarcerated individuals
- number of crime victims
- active-duty sworn police
- formal guilty verdicts
- number of reported vehicle thefts
Here is an explanation of why each of these crime and violence metrics functions as a variable in research, along with the specific units and methods used to measure them:
1. Number of Robberies
- Why it is a variable: The frequency of robberies fluctuates across different neighborhoods, cities, and time periods due to socioeconomic shifts, policing strategies, and urban development. Because it varies from place to place, it serves as a key indicator of public safety.
- How it is measured: Quantified as a count or frequency (e.g., total number of reported robbery incidents per month or year) and often standardized as a rate per 100,000 residents to allow fair comparisons between different geographic regions using official police department records and crime reporting databases.
2. Number of Attempted Murders
- Why it is a variable: Attempted murder rates vary based on localized crime trends, community interventions, and interpersonal violence factors, making it a critical metric for measuring the severity of violent crime in an area.
- How it is measured: Measured as a discrete count of recorded criminal cases where intent to kill was established but the victim survived, typically tracked annually through criminal justice and law enforcement databases.
3. Head Count of Incarcerated Individuals
- Why it is a variable: Prison populations shift dynamically depending on crime rates, changes in sentencing laws, judicial processing speeds, and parole policies.
- How it is measured: Counted as the total head count of incarcerated individuals within a specific correctional facility, regional jail, or national prison system at a given point in time (often reported as an incarceration rate per 100,000 people).
4. Number of Crime Victims
- Why it is a variable: Victimization rates vary significantly depending on demographics, geographic hotspots, and vulnerability factors, serving as a vital measure of the direct human impact of crime.
- How it is measured: Quantified through individual counts or survey-based estimates (such as national crime victimization surveys that capture both reported and unreported crimes) expressed as a frequency or proportion of a population.
5. Active-Duty Sworn Police
- Why it is a variable: Police staffing levels and resource allocations differ widely across municipalities and change over time in response to municipal budgets, policy changes, and recruitment initiatives.
- How it is measured: Measured as a direct count of active-duty sworn police personnel or as a ratio representing the number of law enforcement officers per 1,000 or 100,000 residents in a given jurisdiction.
6. Formal Guilty Verdicts
- Why it is a variable: Conviction numbers fluctuate based on prosecutorial efficiency, court backlogs, the strength of evidence in submitted cases, and judicial outcomes.
- How it is measured: Counted as the total number of formal guilty verdicts or plea bargains secured within a specific judicial district over a set period, sourced directly from court records and judicial administration reports.
7. Number of Reported Vehicle Thefts
- Why it is a variable: Motor vehicle theft rates vary due to factors like vehicle security technology, urban patrol presence, and organized auto-theft rings operating in specific regions.
- How it is measured: Quantified as the total number of reported vehicle thefts per month or year, typically normalized as a rate per 100,000 registered vehicles or residents using law enforcement and insurance industry data.
Phenomenon 3: Poor performance of students in college entrance exams
Examples of variables related to poor academic performance:
- entrance exam score
- number of hours devoted to studying
- student-teacher ratio
- number of students in the class
- educational attainment of teachers
- teaching style
- the distance of school from home
- number of hours devoted by parents in providing tutorial support
Here is an explanation of why each of these academic performance metrics functions as a variable in research, along with the specific units and methods used to measure them:
1. Entrance Exam Score
- Why it is a variable: Entrance exam scores fluctuate across individual students and schools, reflecting varying levels of academic preparation, aptitude, and prior educational quality. Because it measures academic capability outcomes, it serves as a primary indicator of student readiness.
- How it is measured: Quantified as a numerical point score or percentage (e.g., total score out of a maximum possible points) obtained from standardized assessment tests.
2. Number of Hours Devoted to Studying
- Why it is a variable: Study time varies widely from student to student depending on personal discipline, academic demands, and time management skills, directly influencing learning outcomes.
- How it is measured: Measured in hours per week or day, typically gathered through self-reported student questionnaires, time-use logs, or academic tracking surveys.
3. Student-Teacher Ratio
- Why it is a variable: This ratio differs significantly across schools, grade levels, and educational districts, reflecting institutional resources and class sizing policies that affect individual student attention.
- How it is measured: Calculated as a numerical ratio representing the total number of students enrolled divided by the total number of full-time equivalent teachers in a given classroom, school, or district.
4. Number of Students in the Class
- Why it is a variable: Class sizes vary from small seminar groups to large lecture halls, impacting classroom dynamics, student engagement, and instructional delivery.
- How it is measured: Measured as a discrete count of the total number of students officially enrolled and attending a specific classroom session.
5. Educational Attainment of Teachers
- Why it is a variable: Teachers hold different levels of academic qualifications and professional credentials, which can vary across school districts and directly influence teaching competency and student performance.
- How it is measured: Categorized using an ordinal scale or discrete categories (e.g., Bachelor’s Degree, Master’s Degree, Doctorate, or years of formal higher education completed).
6. Teaching Style
- Why it is a variable: Pedagogical approaches vary by instructor and institution (e.g., lecture-based, inquiry-based, collaborative, or flipped classrooms), altering how students absorb and interact with course material.
- How it is measured: Assessed using categorical scales or standardized observation rubrics (e.g., nominal classifications like authoritarian vs. facilitative, or scored indices from classroom observation checklists).
7. The Distance of School from Home
- Why it is a variable: Travel distance and commute times vary based on geographic location, urban vs. rural settings, and residential proximity, affecting student fatigue, punctuality, and attendance rates.
- How it is measured: Quantified in kilometers, miles, or travel time in minutes from a student’s residence to the school campus using mapping data or student surveys.
8. Number of Hours Devoted by Parents in Providing Tutorial Support
- Why it is a variable: Parental involvement and home academic support fluctuate widely based on parents’ work schedules, educational backgrounds, and availability, serving as an external support variable for student success.
- How it is measured: Measured in hours per week spent by parents actively helping with homework or providing tutoring, typically collected via parental or student self-reporting surveys.
Phenomenon 4: Fish kill
Examples of variables related to fish kill:
- dissolved oxygen
- water salinity
- temperature
- age of fish
- presence or absence of parasites
- presence or absence of heavy metal
- stocking density
Here is an explanation of why each of these fish kill and aquatic environmental factors functions as a variable in research, along with the specific units and methods used to measure them:
1. Dissolved Oxygen
- Why it is a variable: Dissolved oxygen (DO) levels fluctuate dynamically in water bodies based on temperature, organic pollution, aquatic plant respiration, and aeration. Because fish and other aquatic organisms rely on oxygen to breathe, sudden drops in DO are the leading cause of fish kills, making it a critical environmental variable.
- How it is measured: Measured in milligrams per liter (mg/L) or parts per million (ppm) of oxygen dissolved in water, typically recorded using calibrated electronic DO meters, optical probes, or chemical titration kits (such as the Winkler test).
2. Water Salinity
- Why it is a variable: Salinity—the concentration of dissolved salts in water—varies significantly due to freshwater runoff, evaporation rates, tidal mixing, and pollution. Sudden salinity spikes or drops can shock aquatic species that have narrow salt-tolerance thresholds.
- How it is measured: Measured in Practical Salinity Units (PSU) or parts per thousand (ppt), and commonly quantified using digital refractometers, conductivity meters, or salinity sensors.
3. Temperature
- Why it is a variable: Water temperature changes daily and seasonally based on weather conditions, industrial thermal discharges, and geographic depth. It directly affects the metabolic rates of fish and simultaneously dictates how much oxygen water can hold (warmer water holds less oxygen).
- How it is measured: Measured in degrees Celsius (°C) or Fahrenheit (°F) using submerged data loggers, digital thermometers, or multiparameter water quality sondes.
4. Age of Fish
- Why it is a variable: Fish susceptibility to environmental stressors (such as low oxygen or toxins) varies across different life stages—from sensitive fry and fingerlings to resilient adults—making age a key biological variable in mortality studies.
- How it is measured: Measured in days, months, or years, often determined using aquaculture batch records, length-weight growth curves, or by analyzing hard anatomical structures like scales, otoliths (ear bones), and fin rays.
5. Presence or Absence of Parasites
- Why it is a variable: The parasitic load or infection status varies across fish populations depending on water quality, crowding, and exposure to vector species. High parasite loads weaken fish immunity and directly contribute to stress-induced mortality events.
- How it is measured: Tracked as a binary (presence/absence) categorical variable or quantified numerically as mean intensity/abundance (counting the number of parasites per host fish) via microscopic examination of gill, skin, and internal organ tissue samples.
6. Presence or Absence of Heavy Metals
- Why it is a variable: Contaminants like lead, mercury, cadmium, and copper enter aquatic ecosystems through industrial runoff and mining waste. Their presence or concentration fluctuates by location and severely poisons aquatic life by accumulating in tissues.
- How it is measured: Initially recorded as a binary category (presence or absence) in screening tests, and precisely quantified in parts per billion (ppb) or parts per million (ppm) using advanced laboratory techniques like Atomic Absorption Spectroscopy (AAS) or Inductively Coupled Plasma Mass Spectrometry (ICP-MS) on water and tissue samples.
7. Stocking Density
- Why it is a variable: In aquaculture and managed fisheries, stocking density (how many fish are raised per unit of volume or area) varies widely depending on farm management practices. High stocking densities accelerate the depletion of dissolved oxygen and increase waste accumulation, directly driving stress and fish kills.
- How it is measured: Measured as the number of fish per cubic meter (fish/m³) or biomass weight per unit area (kg/m²) in ponds, tanks, or cages.
Phenomenon 5: Poor crop growth
Examples of variables related to poor crop growth:
- the amount of nitrogen in the soil
- the amount of phosphorous in the soil
- the amount of potassium in the ground
- the amount of rainfall
- frequency of weeding
- type of soil
- temperature
Here is an explanation of why each of these agricultural and soil factors functions as a variable in research, along with the specific units and methods used to measure them:
1. The Amount of Nitrogen in the Soil
- Why it is a variable: Nitrogen is a primary macronutrient essential for plant leaf growth and chlorophyll production. Its concentration fluctuates across different fields, depths, and management practices (such as fertilizer application), making it a key soil health variable for crop yield studies.
- How it is measured: Quantified in milligrams per kilogram (mg/kg), parts per million (ppm), or kilograms per hectare (kg/ha) of available nitrogen (as nitrate or ammonium), typically measured using standard laboratory soil testing kits, colorimetric analysis, or automated soil analyzers.
2. The Amount of Phosphorous in the Soil
- Why it is a variable: Phosphorus supports root development, flowering, and energy transfer in plants. Its availability varies widely depending on soil pH, parent material, and fertilizer history, directly influencing plant growth rates.
- How it is measured: Measured in milligrams per kilogram (mg/kg) or parts per million (ppm) using standardized extraction methods such as the Bray-1, Mehlich-3, or Olsen tests performed on collected soil samples.
3. The Amount of Potassium in the Ground
- Why it is a variable: Potassium helps regulate water uptake, enzyme activation, and overall plant disease resistance. Soil potassium levels vary based on mineral weathering, crop uptake, and soil management.
- How it is measured: Quantified in parts per million (ppm) or meq/100g of exchangeable potassium, usually determined via ammonium acetate extraction and measured using atomic absorption spectrometry or flame photometry.
4. The Amount of Rainfall
- Why it is a variable: Rainfall determines the natural moisture available for crop root systems and nutrient uptake. Precipitation levels vary drastically across growing seasons, geographic locations, and years.
- How it is measured: Measured in millimeters or inches of precipitation over a specific timeframe (daily, weekly, or seasonal) using on-site rain gauges, weather stations, or agrometeorological tracking databases.
5. Frequency of Weeding
- Why it is a variable: Weed management practices vary from farm to farm (e.g., manual pulling, mechanical tilling, or herbicide application). The frequency of weeding dictates how much competition crops face for light, water, and soil nutrients.
- How it is measured: Measured as a discrete count or rate (e.g., number of weeding operations performed per growing season or weeks elapsed between weed control events) recorded through farmer logs or field observation records.
6. Type of Soil
- Why it is a variable: Soil texture and classification (such as sandy loam, clay, silt loam, or organic peat) vary by region and field. Soil type dictates water retention capacity, aeration, and nutrient-holding ability, which heavily impact plant health.
- How it is measured: Categorized using a nominal classification scale based on USDA soil textural triangles (percentages of sand, silt, and clay) determined through laboratory hydrometer or sieve analysis.
7. Temperature
- Why it is a variable: Ambient air and soil temperatures fluctuate throughout the day and across seasons, governing the biological rates of seed germination, root respiration, photosynthesis, and microbial activity in the soil.
- How it is measured: Measured in degrees Celsius (°C) or Fahrenheit (°F) using digital data loggers, soil thermometers, or local meteorological station records.
Phenomenon 6: How Content Goes Viral
- positive,
- interesting,
- prominent,
- useful,
- surprising, and
- causing physiological arousal.
Notice in the above variable examples that all the factors listed under the phenomena can be counted or measured using an ordinal, ratio, or interval scale, except for the last one. The factors that influence how content goes viral are essentially subjective.
While they start as subjective feelings or traits, researchers convert them into quantifiable data using specific measurement scales and research instruments.
Here is how each one is typically measured:
1. Positive
- Why it is a variable: Content that evokes positive emotions (such as awe, joy, or inspiration) tends to be shared more widely than purely negative content. The emotional valence fluctuates from heavily negative to strongly positive depending on the choice of words, imagery, and framing.
- How it is measured: Measured using ordinal scales (such as Likert scales rating text tone from 1 = “Very Negative” to 5 = “Very Positive”) or through nominal categorization via automated sentiment analysis tools that classify media or text as positive, neutral, or negative.
2. Interesting
- Why it is a variable: The degree to which a topic captures and holds a reader’s attention varies significantly based on novelty, relevance, and presentation style.
- How it is measured: Quantified through behavioral engagement metrics (such as average time-spent-reading, scroll depth, and interaction rates) or subjective rating scales where respondents evaluate interest levels on a 1 to 7 scale.
3. Prominent
- Why it is a variable: Prominence refers to how visibly or centrally a piece of information, headline, or brand is displayed. Highly prominent content catches the eye faster and influences click-through rates.
- How it is measured: Assessed by evaluating visual hierarchy and placement. Researchers measure this by counting keyword frequencies, tracking visual dominance (such as font size and header placement), or using ordinal ranking scales.
4. Useful
- Why it is a variable: Content that provides practical value, actionable advice, or solves a specific problem is frequently shared by users looking to help their peers. The level of perceived utility varies by target audience.
- How it is measured: Assessed using perceived usefulness survey scales (asking users to rate utility from “Not at all useful” to “Extremely useful”) or tracked via practical digital outcomes like total bookmark frequencies, share counts, and download metrics.
5. Surprising
- Why it is a variable: Content that defies expectations or challenges conventional wisdom triggers curiosity and social sharing. The element of surprise varies based on how counter-intuitive or novel the information is.
- How it is measured: Quantified via self-reported emotional impact scales (rating the degree of unexpectedness from 1 to 5) or by observing immediate cognitive and facial expression markers in controlled testing environments.
6. Causing Physiological Arousal
- Why it is a variable: High-arousal emotions—whether positive (like excitement and awe) or negative (like anger and anxiety)—activate the autonomic nervous system and drive people to share content. Low-arousal emotions (like sadness) typically suppress sharing.
- How it is measured: Measured objectively using biological and physiological indicators. Researchers use tools like Galvanic Skin Response (GSR) to measure sweat gland activity, heart rate variability (HRV), or facial electromyography to track micro-muscle tension associated with high-energy states.
The expected values derived from these variables will be in terms of numbers, amount, category, or type. Quantified variables allow statistical analysis. Variable descriptions, correlations, or differences are then determined.
Examples of Independent and Dependent Variables
Which of the above examples of variables are the independent and the dependent variables?
Independent Variables
The independent variables are those variables that may influence or affect the other variable, i.e., the dependent variable.
For example, in the second phenomenon, i.e., crime and violence in the streets, the independent variables are the number of law enforcers. If there are more law enforcers, it is expected that it will reduce the following:
- number of robberies,
- number of attempted murders,
- number of prisoners,
- number of crime victims, and
- the number of carnapping incidents.
The five variables listed under crime and violence in the streets as the theme of a study are all dependent variables.
Dependent Variables
The dependent variable, as previously mentioned, is the variable affected or influenced by the independent variable.
For example, in the first phenomenon on climate change, temperature as the independent variable influences sea level rise, the dependent variable. Increased temperature will cause the expansion of water in the sea. Thus, sea-level rise on a global scale will occur.
I will leave the classification of the other variables to you. Find out whether those are independent or dependent variables. Note, however, that some variables can be both independent or dependent variables, as the context of the study dictates.
Finding the relationship between variables
How will you know that one variable may cause the other to behave in a certain way?
Finding the relationship between variables requires a thorough literature review. Through a review of the relevant and reliable literature, you will find out which variables influence the other variable. You do not just guess relationships between variables. The entire process is the essence of research.
At this point, I believe that the concept of the variable is now clear to you. Share this information with your peers, who may have difficulty in understanding what the variables are in research.
Frequently Asked Questions (FAQs)
What are examples of variables in quantitative research?
In quantitative research, variables are measurable characteristics that change or vary across subjects or data points. Examples include:
Numeric Continuous Variables: Age, monthly income, temperature, and height (can take any numerical value on a scale).
Numeric Discrete Variables: Number of children, frequency of visits, or number of errors (counted in whole numbers).
What are examples of variables in a research paper?
Common examples found across research papers depend on the specific phenomenon being studied. For instance:
In Educational Research: Student-teacher ratio and hours devoted to studying (independent variables) affecting entrance exam scores (dependent variable).
In Environmental Research: Amount of rainfall and soil nitrogen levels affecting crop growth.
What are examples of variables in a research proposal?
When outlining a research proposal, variables must be explicitly defined so they can be measured. For example, if your proposal investigates workplace productivity:
Independent Variable: Number of hours spent in remote work training.
Dependent Variable: Employee output score per week.
Extraneous Variable: Employee work experience or age (controlled during the study).
What is the importance of variables in research?
Variables are vital because they transform abstract research concepts into measurable, concrete data. They allow researchers to:
Clearly define the scope and focus of a study.
Establish cause-and-effect relationships or correlations.
Build a reliable conceptual framework and run accurate statistical analyses.
What are the main types of variables in quantitative research?
Quantitative research primarily categorizes variables into several key types:
Independent Variables: The presumed cause or predictor that is manipulated or observed to see its effect.
Dependent Variables: The outcome or response measured to see how it is affected by the independent variable.
Mediating (Intervening) Variables: Factors that help explain the mechanism or relationship between the independent and dependent variables.
Moderating Variables: Factors that influence the strength or direction of the relationship between independent and dependent variables.
Control Variables: Extraneous variables that researchers hold constant to prevent them from confounding the study results.
Building Your Thesis?
Variables are just one piece of the puzzle. Discover how to connect them properly by reading our comprehensive guide on building a conceptual framework.
Read the Conceptual Framework Guide →©SimplyEducate.me | Patrick A. Regoniel
Thank you, I am struggling with trying to develop a conceptual framework for my future dissertation, this article was a lot easier to understand than my text books!
In the last line of the second paragraph under “Difference betw indep and dep variables” you didn’t finish your edit, sooooooo take a look again, do you want to talk about crime or student success?
And thank you for writing these simplified explanations, I’m ready to tackle my proposal again, with renewed confidence!
Thank you for your feedback Randi. That’s very much appreciated.
Clear, simple, easily understood! I’m so grateful! Thank you so much for explaining it in a way that a slow witted like me can comprehend.
Hi, i really need your help mr. Patrick. May i know the IV and DV of the other examples you have given? So i can understand it more? Pretty please?
Dear Ella, whether variables are dependent or independent depends on context. Basically, the independent variable is the one causing the dependent variable. It’s a cause-effect relationship. The dependent variable responds to the effect of the independent variable. That is explained in the latter part of the article.
wow! information made simple! Finally I get a clear understanding of what variable means. I am also able to differentiate between the two. What a relief!
Thank You very much
exactly right? This page is a life savior! 😀
Yess i want to
thanx alot. Your well simplified work has given me insight in my research approach
Thanks for the explanation. I’ll really appreciate more if you can elaborate the roles variables play in research. Thank you.
please help me answer these questions:
1. Should a dissertation always have independent and dependent variables?
2. Does a good dissertation always need quantitative variables?
Please reply me or email me at arvella_medina@yahoo.com
wow this is very helpful i am just strugling to write my thesis.
The explanation is simply great. More grease to your elbow.
Thank you very much for this simple and clear clarification of the difference between dependent and independent variables
Thank you Ogah. It’s great to know the article’s useful.
wol, this article is indeed helpful
Great explanation! easy to understand,this article can help me a lot for my report about conceptual framework and research study. Now I understand what variable means, as well as the difference between independent and dependent variable. Thank you so much!
The problem of DVs and IVs above is that they can be either. Example given is temperature being the IV and sea level being the DV. However, temperature can also be the DV if carbon emissions are the IV. Equally, carbon emissions can be the DV if car sales are the IV…
You’re right Gabe. Independent variables may be the dependent variables. The objectives of the study will define which one/s is/are the DV or the IV. In modeling ecosystems, if either of the variables could influence the other, these are called feedback loops.
Patrick,
Thank you for this article. I really appreciate your efforts and your way of explaining it. Very simple but extremely meaningful. As I was reading the climate change sample, I was asking myself where are the DV and IV, and then whether the temperature would be listed under the DV or IV. I was going to ask that question but I am glad that Gabe asked it and you answered it perfectly.
Great it helped you Bard. Thank you for visiting SimplyEducate.me and reading the articles.
Thank you for such an easy explanation.
Thank you so very much.
totally brief and simply explanation. Thanks a lot, this helps understand variables better.
Thanks for the explanation, keep on the good work…
For me you simplified it when you said Independent variable is the cause, I just say thank you.
The explanation on DV and IV was simply fantastic. it helped defused the tension on my brain. thank you very much!
Great to know your feedback y.y. barry.
Thanks, for explaining how to use variables. My understanding is better.
Welcome Issy. I’m glad to be of help. Thank you for reading.
what asimpler and short explanation of variables!more examples on theoretical framework
Thank you Janet. You may read my post about conceptual framework and its relation to theoretical framework here: https://dev.simplyeducate.me/2015/01/05/conceptual-framework-a-step-by-step-guide-on-how-to-make-one/
I, with all my experience in research, would not put the explanation in such a plain, understandable way. kudos
Someone else explain statistics in the same plain language.
I am so pleased and impressed with this article that I am here redoing my framework for my dissertation. Most of the time tutors don’t explain this way and I think it is just great.
Dear Martin, great to hear your feedback! I’m happy to know my article helped you in your research venture. Let’s discover things for a better world. Share the information to your friends who may have difficulty along this concern.
Hi,
Do I have to depict the two variables within the topic of a thesis?
Dear Alvisswe,
I am not quite clear about your question. If you mean that you should include the two variables in your thesis title, that will be desirable. It gives the reader an idea about what you are investigating right there in the title.
Hello can anybody here help me to make a quantitative research title with 3 dependents variables…thank.you..
Dear Lovely, think first what you want to study about.
I have been trying all these years to come out with research proposal for a doctoral programme with great difficulty. It’s like groping in the dark looking for a needle in a haystack. At a point I wanted to give up on the PhD programme. Your presentation has been fantastic. It wouldn’t have come at the right time. It’s a WOW! Very useful.
Can I please have your email?
My project topic is Extra judicial killings and involvement of military forces,how do i go about drawing my theoritical framework and what variables best suits
My project topic is Extra judicial killings and involvement of military forces,how do i go about drawing my conceptual framework and what variables best suits
Dear Quad, just follow the procedure outlined above. You need to be familiar with factors that surround extrajudicial killings. Since your conceptual framework reflects your thesis, you need to state your argument as your guide in your study. Here are some tips: https://dev.simplyeducate.me/2016/01/23/three-tips-on-how-to-write-a-thesis-statement/
I was considering to enroll in statistics course to equip me in my consultancy work (socio-economic studies), found this site very informative, I need to really study though.
Thanks for visiting this site Annabelle. You need diligence to understand concepts that you can use in your consultancy. Thank you for visiting the site.
hi! What if there are more than the independent and dependent variable? How are we going to describe the other variable? For example A influence B then B gives impact to C.. Please help..
even i need this answer
hi help me my research is about personnel empowerment and local government quality service what will be my conceptual frame work ???
Just open the forum page (https://dev.simplyeducate.me/forum) abdul and I will answer you there.
Thanks you all for this wonderful presentation, my question is, is the variable the same as factors
My topic is : emplementing word processing in high school to improve students writing skills. Now, can you tell me what would be my variables? please.
Dear Eliseu, so why do you think word processing can improve students’ writing skills? Do you mean spell or grammar checks in MS word? You need to define your variable, as this article defines it.
Thank you so much. I have been struggling with the concept of variables. Now you have solved my problem. Thanks
Welcome Edward.
I appreciate the effort made in explaining the key variables with some relevant examples. However, there are still more to explain with regards to other variables such as: moderating variable, intervening variable, extraneous variables, mediating variable and confounding variable. If these can be explained with good examples especially in social researches, then a ot will have been done.
Dear Dr. Oyugi, you’re right. If you know about these kinds of variables then you are free to share them here. Thanks for dropping by.
Thank you for this.. And also for gabe’s concerned aboout those DV and IV.. Sorry for my grammar
gud pm sir Patrick.. do IV and DV should be in a title.
Dear Dennis, the title ideally should have those variables for easier understanding of what is discussed in the paper.
I am a student in the masteral degree…i am having hard time in formulating a title …our title defense was scheduled september 9..i have proposed almost a dozen titles now but my thesis professor rejected it …i dont know why……my title is CLASSROOM MANAGEMENT ON PUPIL’S BEHAVIOR AND ACADEMIC PERFORMANCE OF GRADE V PUPILS….may i ask for your help to reword or restate my title…how is it measured….i am open to suggestions and comments thank you and more power…i will love to hear some thots from youGod bless
Dear Marlyn, I missed your comment as I had been too busy the past days. It seems like you’re not so sure about what to study. What is it you want? If it is clear to you, then you can conduct a study. You do not start with a title but a review of literature first on a phenomenon you have observed. You may find this article useful: https://dev.simplyeducate.me/2012/10/31/how-to-write-a-concept-paper/
pls sir i need your help on my assignment
Title: write three research topics, mention the dependent and independent variables
Thanks alooooooot
Need your email address have a lot to ask
this brainstorming is real vital towards my course of studies
this brainstorming is really vital towards my course of studies thx professor
Welcome Paul. I’m glad this article helped you.
Hello
Can I ask you?what variable we can used to our thesis its all about Job Satisfaction?
Our title in thesis is
“An Analysis of job satisfaction of company(name)employee:basis for employee retention program”
Plz help me to know the variables for that topic and to create a theoretical framework.
Thank you
Dear Ahpz, you already mentioned your variables, i.e., job satisfaction as dependent variable and the reasons why they are satisfied (these are your independent variables).
This is really “wow” explanation. I had no ideas about the term “variable” in the writing of the thesis. Now I have some idea. Kindly help me to clarify my topic and its valuables . I intend to write on children’s right to education during emergencies. I want to see how the disaster risk management policy can be of importance in a particular country.
Dear Eddie, your topic is too broad. See comment below.
Topic is
Impact of IT in supply chain
What are variables? Please help
Dear Rahim, what do you mean by impact? Can you measure it? And what specific IT factor would you want to study? The point is, your study is too general/broad. Narrow it down further into something measurable. For example: IT might be knowledge of databases, and supply chain is time in moving the product. These factors are measurable.
Thank you for writing this.
Am doing a sociology paper this are some of the instructions. Explain why the social pattern interests you, and how it can be seen as a variable. Identify another variable that you think is a possible cause and explain why you think it might be a cause. Identify a third variable that you think is a possible consequence of your first variable and why you think it might be a consequence. (In other words, you need to identify three variables—A, B, and C. And you will focus on two hypotheses: A affects B, and B affects C.) Do not use a hypothesis that was covered in the readings or in class. Also, avoid hypotheses you know (for certain) are true or hypotheses that are necessarily true.
I have chosen
Poor performance of students in High school on exams
My 3 variables would be…
1. Exam score
2. Amount of hours devoted to studying
3. The number of hours dedicated by parents in providing tutorial support.
what do you think? is it okay and am lost in making 2 hypothesis. Please help!!
Thank you for writing this.
Am doing a sociology paper this are some of the instructions. Explain why the social pattern interests you, and how it can be seen as a variable. Identify another variable that you think is a possible cause and explain why you think it might be a cause. Identify a third variable that you think is a possible consequence of your first variable and why you think it might be a consequence. (In other words, you need to identify three variables—A, B, and C. And you will focus on two hypotheses: A affects B, and B affects C.) Do not use a hypothesis that was covered in the readings or in class. Also, avoid hypotheses you know (for certain) are true or hypotheses that are necessarily true.
I have chosen
Poor performance of students in High school on exams
My 3 variables would be…
1. Exam score
2. Amount of hours devoted to studying
3. The number of hours dedicated by parents in providing tutorial support.
what do you think? is it okay and am lost in making 2 hypothesis. Please help!!
Dear Ari. Social patterns refer to trends and people’s behavior. Is exam score a trend or behavior? Find a social trend or behavior that is interesting and start from there. For example, you can inquire on the increasing hours spent by students online and their lack of actual, face-to-face interaction with peers. The greater affordability of internet connection may be a cause. And affordability may be caused by higher income among families.
help me find variables,
challenging facing Tanzanian SME’s in creating sustainable competitive advantages through brand loyalty and brand awareness
can you help with the variable for this topic: An assessment of home-ownership finance by mortgage institution
That’s too broad Salamarh, what do you want to find out in the study? Why do you want to assess home ownership? Have a clear purpose first that will aid you in coming up with your conceptual framework.
Thank you so much. I only needed this. Great!
I want to be.10examples for (Iv and Dv)
I want that
Great write up!! Thank you immensely.
Unfortunately, i still find it difficult writing a conceptual framework. My topic is: Attitude towards infertility screening among males. Here, i suppose that “attitude” is the independent variable and “screening” the dependent variable. That is, whether males will subject themselves to screening is a function of attitude.
Please show more light on this.
Thanks again.
Well, that seems okay Enomen. Just how do you propose to measure attitude?
am writing a proposal for the factors that influence adoption of improved agricultural practices on cocoa production
what will be my conceptual framework
I was in little confusion about difference among variables. Now my concept is clear! Thanks a lot Sir!
My Proposal ahs been Accepted. ITs about Mentoign and coaching to reduce drop of learners in Workplac based learnerships in the hospitality Sector. I need guidance on Variables and like framework.
thank much now am familiar wit variable
I read most of your works sir and I must Thank you for making things easier to me. I appreciate it more cause I can now understand such things easily, well compared to my paraphernalia. The page name says it all. Simple educate me. Thank you Sir! 🙂
ps, from Philippines here! 🙂
Dear Ela, it’s a relief to read feedback from you. I just need that encouragement to go on and help students out there who want to use research as a tool to advance themselves. As the name of this website says, my write up is designed to simplify concepts into easy to understand chunks of information. I’m glad that somehow the articles helped foster understanding. Thank you…
My research is correlational, and I have three variables. I’m confused with my IV an DVs. My variables are: Religiosity, Subjective-Well Being and Depression. So, is Religiosity my IV and the rest are DV?
Hello sir…
Please help me to make an example of quantitative research title with 3 dependent variables…thank you
Dear Regoniel, Patrick A.
I have a question, suppose I have a variable “Gender Diversity”. In my survey questionnaire I have three questions about it. So, when I want to check the relationship between “gender diversity” and “performance of the firm”, what shall I do to make a scale on SPSS? Like three questions make one variable but when checking this variable, which question shall I consider out of three or shall I combine all three questions and divide it by the number of questions to make representative variable?
Note: I am using LIKERT Scale for this survey.
I would highly appreciate if you can help me with clearing the confusion. I have tried several books but did not find any specific way to check how the variable should be considered.
Looking forward to hear from you.
Regards,
Dear Nasreen, my apology for the late reply. You need to define “gender diversity” and “performance of the firm” as variables of the study so I will be able to give advice.
thank you so much
Hi po Sir Patrick. Sir ‘di ba po kailangan ng questionnaire ang dalawang variable?
thank you for being generous those two words have been confusing me in research now i am a better person.
My topic is the importance of learning other language towards inbound and outbound tourist.
How do i identify the variables?
hi simplyEducate.Me
thank so much for this article you’ve been really helpful.
I need help with this research topic ‘Media production and production in America’ I’m finding it difficult in identifying the concept, construct and also I’m trying to develop three research questions and also find the three null hypothesis related to the topic. I would really appreciate if you throw more light on this. thank you.
Hi, pls how do I write hypothesis for this topic I found on your site ‘poor performance of students in college entrance examinations
I have noticed you don’t monetize your site, don’t waste your traffic, you can earn extra
cash every month because you’ve got high quality
content. If you want to know how to make extra $$$, search for:
Mertiso’s tips best adsense alternative
Thanks so much sir,I have really learned a lot about literature review. But I still have a problem identifying my variables,my topic is;The constraints to social civic engagement in Communities in my country. Please give me an idea on what my variables would be.thannks
Wwoow…. Thanks a lot you have simplified my understanding of variables in research.
Big applause
Your tutorial is candid and very easy to digest. I have enjoyed the piece. It has enhanced my perspective of variables.
Thank you very much.
How can I write my concept on this topic ” Influence of Culture on functionality of rural water supply”
Hello sir, sorry to bother you but what are the guidelines for writing a good report
Guidelines for writing a good research report?
Can you please give me what are the possible variables in terms of installation of street lights along barangay roads of calauan, laguna: an assessment?
Thanks so much !
This article is so much simple to my understanding. A friend of my referred me to this site and I am so greatful.
Please Sir, when writing the dependent and independent variables should it be in a table form ?
Dear Grace,
Good day. I don’t understand what you mean. But if your school requires that the independent and dependent variables be written in table form, I see no problem with that. It’s just a way for you to clearly show what variables you are analyzing. And you need to justify that.
Hi Regoniel…your articles are much more guiding….pls am writing my thesis on impact of insurgency on Baga Road fish market Maiduguri.
How will my conceptual framework looks like
What do I need to talk on
Dear Alhaji, just be clear about what you want to do. Your research question must be clearly stated before you build your conceptual framework.
I am requested to write 50 variables in my research as per my topic which is about street vending. I am really clueless.
Hey, I really appreciate your explanation however I’m having a hard time figuring out the IV and DV on the topic about fish kill, can you help me?
CHALLENGES FACING DEVELOPMENT OF COOPERATIVE MOVEMENT IN TANA RIVER COUNTY
What is the IV and DV of this Research topic?
Dear Daur,
You can see in the last part of the above article an explanation about dependent and independent variables.
Dear Maur, what you just want to do is to describe the challenges. No need for a conceptual framework.
Dear Sophia and Hamse,
As I mentioned earlier, please read the last part of the above article on how to determine the dependent and independent variables.
Dear Hamse,
That depends on what variables you are studying. Are you doing a study on cause and effect?
This was extremely helpful and easy to digest
thanks for the explanation a bout variables. keep on posting information a bout reseach on my email.
A well articulated exposition! Pls, I need a simple guide on the variables of the following topic : IMPACT OF TAX REFORMS ON REVENUE GENERATION IN NIGERIA: A CASE STUDY OF KOGI STATE. THANKS A LOT.
Thank you very much for your nice NOTE!
I have a question: Can you please give me any examples of variables in students’ indiscipline?
I salute your work, before I was have no enough knowledge about variable I think I was claimed from my lecturers, but the real meaning I was in the mid night. thanks
Great work. I’d just like to know in which situations are variables not used in scientific research please. thank you.
Dear Calvin, when you state your research objectives that’s where you will know if you need to use variables or not.
Your question is unclear to me Biyaminu. What do you mean? If you want to cite this, see the citation box after the article.