
If you engage in quantitative data analysis, it is a must that you read this guide on how to write good statistical questions to avoid data analysis problems once your data trickles in.

Table of Contents
Background
I noticed that even if my undergraduate students have finished their college degrees ending with a thesis, many of them still could not write statistical questions. They lack the background necessary for a successful analysis of the data gathered in the field.
It is easy to discern right away that the problem stems from the lack of adequate training on how to frame research questions such that they are able to analyze data arising from those questions. When dealing with numbers, asking good statistical questions are vital in data analysis using a statistical software such as SPSS.
Writing good statistical questions is a major challenge for many researchers.
However, mastering this skill is a crucial element for successfully analyzing voluminous numerical data. Consequently, graduate students in particular must prioritize writing good statistical questions to ensure the success of their graduate school research (see the Ultimate Graduate Research Guide to guide you in your graduate school journey).
I am convinced that one of the reasons for not being able to do so relates to the apparent disharmony between their knowledge of statistics and their research subjects. There appears to be a need to match the undergraduate curriculum to what is required in graduate school.
If you are one of those who find it challenging to frame statistical questions, then this article is for you. But before you attempt to write a statistical question, please read my article about variables.
A good understanding of the different types of variables as to measurement scale would help you frame the research questions correctly. You should be able to discriminate between the four types of variables, namely nominal, ordinal, interval, and ratio.
Now, if you are already well familiar with the different types of variables, continue reading.
What is a Good Statistical Question?
Let’s first define what we mean here by a statistical question. Defining the concept levels up our understanding of abstract terms that we often encounter while studying quantitative data analysis.
A statistical question is a question that is designed to be answered by collecting and analyzing data, with the expectation that the data will show variability rather than a single fixed response. Unlike a factual or deterministic question that has only one correct answer, a statistical question recognizes natural differences or fluctuations in the subject being studied and seeks to understand, describe, or explain patterns within that variability.
A statistical question is a question that is designed to be answered by collecting and analyzing data, with the expectation that the data will show variability rather than a single fixed response.
To answer it, one must gather information from a group, process or phenomenon, then apply statistical tools—such as measures of central tendency, variability, or probability—to summarize the data and draw meaningful conclusions.
Now, let’s proceed on how we can write good statistical questions that apply the concept we have just defined.
3 Tips on How to Write Good Statistical Questions
In writing the statistical questions, you need to bear in mind three things. These essential considerations are given below.
1. A Good Statistical Question Produces Data with Variability
A statistical question is one that requires the collection of data with expected variability in it. The data collected changes in value. You can quantify them.
If the data could not be measured, then you have to think it over again. Figure out how a phenomenon should be captured in such a way that the defining features are measurable.
If a phenomenon is quite complex, a quick search online in research databases will shorten the time you spend identifying the relevant variables. Or perhaps, a quick visit to your study site will help clarify the questions in your mind.
You may also try Google Scholar, to identify what variables are being investigated along your field of study. If Google Scholar sounds new to you, you may read the post: How to Use Google Scholar.
2. A Good Statistical Question is Not Readily Answered
A good statistical question is not readily answered by a DEFINITE, DETERMINISTIC, or SINGLE answer. The expected response assumes VARIABILITY as pointed out before and is not readily answered.
For example, a question like “How long does it take you to read this article?” is quite simple and quickly answered. You can switch on your cellphone’s stopwatch function, start reading, and then push stop once you are reading.

But if you ask, “How much time do you spend reading articles in one week?” This question requires you to note how much time you spend reading articles online.
In this instance, the question becomes inherently statistical because the duration of time spent reading an article varies with each occurrence.
Because this data fluctuates rather than remaining constant, the question cannot be answered with a simple, singular fact. Instead, it requires systematic data collection and analysis, thereby lending itself to more rigorous empirical research.
3. The Answer to a Good Statistical Question Has a Distribution and Tendency
By definition, the answer to a statistical question exhibits both variability—resulting in a data distribution—and a central tendency. Consequently, any inquiry that yields data characterized by these two features is inherently statistical.
Simply put, you cannot have a distribution or tendency if you only have one datum available.
The data generated by the statistical question are numerical or assumes a range of numbers. You can compute for the mean, median, and mode for that answer. We call that in your undergraduate years as MEASURES OF CENTRAL TENDENCY.
Again, the data obtained from a statistical question can show the spread of the data.
Is the data skewed or distributed towards the higher or lower portions of a scale? If it does, then the question posed is statistical.
Look at the figure below, which roughly shows a normal distribution and a skewed data distribution.
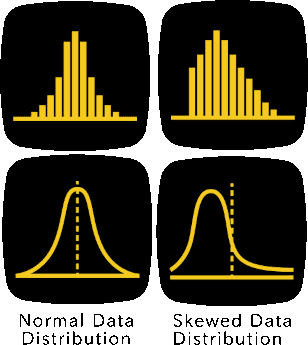
Researchers can compare distinct datasets by analyzing their underlying distribution patterns and measures of central tendency. When a meaningful difference exists between two groups, plotting them together visually highlights two separate distribution curves.
In quantitative data analysis, this visual divergence corresponds directly to statistical significance, which can be verified using a parametric Independent Samples t-test for normally distributed data, or a nonparametric Mann-Whitney U test if the data violates normality assumptions.
Examples of Good Statistical Questions
The following examples illustrate how good statistical questions are written.
- On average, how long does it take a runner to finish a full marathon?
- On average, how many hours of sleep do remote workers get per night compared to office-based workers?
- On average, how long does it take an entrepreneur to reach profitability after launching a startup?
- Is there a correlation between the height and confidence level of fresh graduates applying for work?
- Is there a difference between internet-based and traditional assessment methods?
- Is there a difference between men and women in weight loss success?
- Is there a correlation between student academic performance and time spent online?
- Is there a correlation between a person’s average daily screen time and their self-reported anxiety levels?
- Is there a correlation between the starting salary of a new hire and the number of internship experiences on their resume?
- Is there a correlation between an individual’s physical fitness level and their productivity score at work?
- Is there a correlation between a high school student’s financial literacy score and their parents’ household income?
- Is there a difference between public school and private school teachers regarding job satisfaction?
- Is there a difference between hybrid cars and traditional gasoline cars in long-term maintenance costs?
- Is there a difference between introverts and extroverts in their preference for remote work?
- Is there a difference between reading comprehension scores when students use digital tablets versus printed textbooks?
These statistical questions are not quickly answered, require data collection that varies, and have distributions and tendencies. The examples follow all of the requirements of good statistical questions.
More examples here: Statistical Research Questions: Five Examples for Quantitative Analysis
Frequently Asked Questions (FAQs)
What makes a question a “statistical question”?
A question is considered statistical if it is designed to be answered by collecting and analyzing data that exhibits natural variability. Unlike a deterministic question which has a single, fixed factual answer, a statistical question anticipates that different subjects or scenarios will yield multiple, fluctuating data points.
What are the 3 main characteristics of a good statistical question?
According to the foundational rules of data analysis, a good statistical question must satisfy three criteria:
Data Variability: The question must yield a wide range of responses or numbers rather than a single, flat answer.
Not Readily Answered: It cannot be resolved with a quick factual lookup; it requires intentional data gathering and investigation.
Distribution and Tendency: The compiled results must display a distinct pattern, allowing you to map out a distribution and compute measures of central tendency like the mean, median, or mode.
What is an example of a statistical vs. a non-statistical question?
Non-Statistical (Factual): “How long did it take the winner to finish today’s marathon?” This results in a single, unvarying data point.
Statistical: “On average, how long does it take a runner to finish a full marathon?” This is statistical because it looks at a diverse population group, expects variable finish times, and requires calculating an average tendency.
Can a statistical question have a distribution pattern?
Yes, the data generated by a good statistical question will always show a distribution and spread. When you plot the collected numerical data, you can analyze its shape to see if it follows a normal bell curve or displays a skewed distribution. This distribution pattern is what allows researchers to safely compare different groups against one another using tools like a t-test or a Mann-Whitney U test.
How do you write a statistical question to test for a relationship or difference?
To test for relationships or differences, frame your question around two or more distinct variables or demographic groups.
To test for correlation: “Is there a significant correlation between student academic performance and total time spent online?”
To test for a group difference: “Is there a significant difference between men and women regarding weight loss success?”
© Simplyeducate.me | P. A. Regoniel