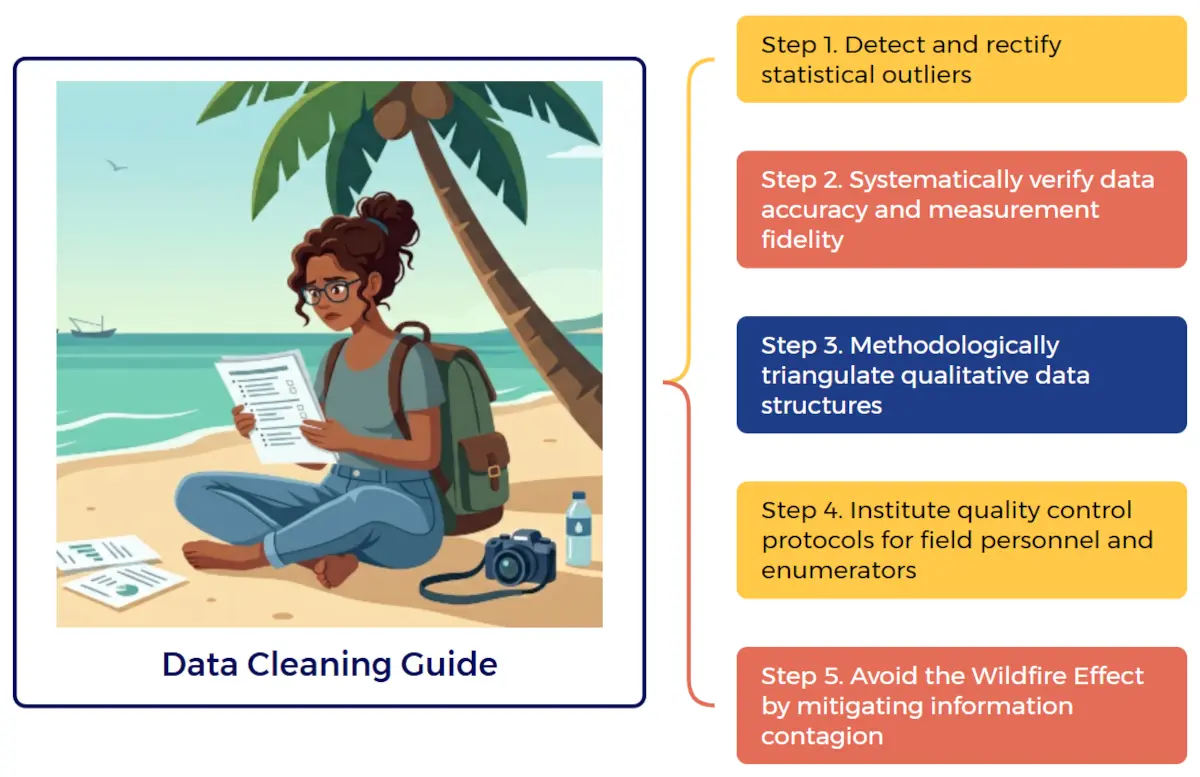
This data cleaning guide outlines 5 steps on how to optimize data for both quantitative and qualitative data. Data cleaning or data preprocessing ensures data integrity and analytical fidelity.

Table of Contents
Data analysis is only as rigorous as the empirical quality of the primary data gathered during the collection phase.
This article outlines five essential pre-analysis steps designed to secure data integrity, accuracy, and operational reliability. This approach works best in mixed methods research designs.
The Premise of Analytical Fidelity
Statistical analysis is a foundational pillar of the graduate research process. Prior to executing algorithmic models, researchers must systematically verify the precision of their underlying data structures.
Modern statistical software environments—ranging from programmatic frameworks (SAS, Stata, R) and dedicated graphical suites (SPSS, Statistica, SOFA Statistics, JASP) to baseline spreadsheet utilities (MS Excel Analysis ToolPak, Gnumeric)—have streamlined the execution of complex computational workflows.
However, ease of execution does not equate to analytical validity. If the underlying datasets are compromised, the outputs are fundamentally invalidated—an operational manifestation of the “Garbage In, Garbage Out” (GIGO) paradigm.
Within academic research, graduate students facing strict thesis timelines occasionally underemphasize rigorous data preprocessing or, in worse scenarios, selectively alter data structures because empirical trends deviate from initial hypotheses. Such compromises subvert the scientific method.
In high-stakes business environments, decisions derived from flawed analytical premises yield catastrophic financial and operational consequences.
Consequently, data analysts must enforce strict quality controls before routing data into visualization and computational platforms like Tableau, Excel, R, or SAS.
Theoretical Framework: Data Integrity vs. Volatility
To maximize the statistical power of field data, researchers must bridge the gap between raw data collection and exploratory data analysis (EDA). Data integrity requires active oversight during both quantitative and qualitative collection paradigms to mitigate human error and systemic bias (Figure 1).

To ensure the quantitative integrity of data, there should be a boundary constraints check and distribution normalization. Along the same vein, ensuring the qualitative integrity of data requires contextual validity and source verification.
1. Quantitative Integrity (The Numbers Side)
This focus ensures that the numerical data is accurate, consistent, and usable for mathematical analysis. It uses two main techniques:
- Boundary Constraints Check: This means setting strict rules for the allowable range of your data to catch errors. For example, if you are collecting human ages, a boundary constraint would flag an entry of -5 or 200 as an error. It keeps data within realistic, logical limits.
- Distribution Normalization: This involves adjusting the scale of your data so different variables can be compared fairly. For example, if you are comparing test scores from two different schools—one graded out of 100 and the other out of 20—normalization converts both to the same scale (like percentages) so your statistical analysis isn’t distorted.

2. Qualitative Integrity (The Meaning Side)
This focus ensures that the descriptive, non-numerical data (like text, categories, or descriptions) is trustworthy and makes sense in the real world. It relies on two main practices:
- Contextual Validity: This checks whether the data makes sense within its specific setting or environment. For example, if a medical database lists a patient’s diagnosis as “pregnancy,” but the gender column says “male,” the data lacks contextual validity. The information might be a real word, but it is incorrect in this specific context.
- Source Verification: This is the process of double-checking where the data came from to ensure it is reliable, authoritative, and untampered with. It answers the question: “Can we trust the person, system, or organization that provided this information?”
When data collection protocols lack verification, the downstream interpretation is systematically compromised, culminating in invalid structural conclusions.
These concepts will be tackled in more detail in the five data cleaning or data preprocessing stages listed in the next section.
How to Ensure Data is Accurate: 5 Steps of Data Cleaning or Data Preprocessing
Step 1: Detect and rectify statistical outliers
A primary objective during exploratory data analysis is the identification of outliers—data points that deviate anomalously from the established statistical measurement scales or structural boundaries of the dataset.
Diagnostic Actions
- Distinguish Structural Errors from True Anomalies: Researchers must meticulously cross-reference extreme values with original field records to determine if the deviation stems from a typographical entry error (e.g., a misplaced decimal or missing zero) or represents a legitimate, albeit rare, phenotypic/behavioral variance.
- Deploy Visual Analytics: Scale-based data distributions should be evaluated using visual diagnostics before computing inferential statistics.
Comparative Visual Impact
Using visual models, such as scatter plots for bivariate correlation (Figure 2) or histograms for univariate distribution profiles, exposes hidden anomalies that skew parametric tests:
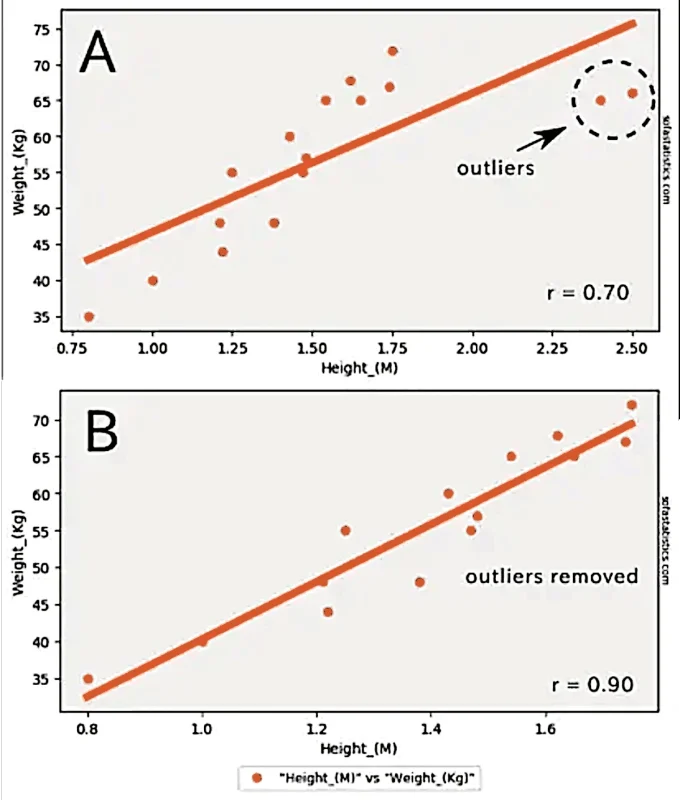
As demonstrated in comparative modeling, an unaddressed outlier exerts undue leverage on the ordinary least squares (OLS) trendline. This pulling effect artificially suppresses the Pearson correlation coefficient from a true value of r=0.90 down to r=0.70, distorting the true effect size and increasing the risk of Type II errors.
Step 2: Systematically verify data accuracy and measurement fidelity
The algorithmic processing of empirical data operates strictly under the Garbage In, Garbage Out (GIGO) paradigm.
In computational architectures, statistical software platforms execute analytical calculations deterministically, processing entered values without inherent context or error detection.
Consequently, entering erroneous metrics yields mathematically valid but empirically spurious output, severely undermining the internal validity of the study (Figure 3).

Minimizing Measurement Error
Data verification must occur at two distinct checkpoints: prior to digital ingestion and immediately post-entry within the database layer (e.g., SPSS, R DataFrames, or Excel sheets).
Minor clerical entry errors—such as order-of-magnitude shifts (adding an extra zero) or category misallocations—corrupt the covariance structure of the dataset, distorting trend lines, visual distributions, and parametric assumptions.
To formalize error minimization, researchers must evaluate data based on the hierarchy of statistical measurement scales:
- Categorical / Nominal and Ordinal: Require categorical constraint validation to prevent cross-category contamination.
- Interval and Ratio: Represent the highest degrees of mathematical precision. They are highly susceptible to observer variance and clerical volatility, but offer the most robust statistical power when cleaned properly.
While absolute elimination of measurement error is statistically impossible due to varying observer scrutiny, implementing double-entry verification and range-bound data constraints limits random variance to acceptable statistical margins.
Step 3: Methodologically triangulate qualitative data structures
While quantitative datasets rely on scale verification to ensure reliability, qualitative research structures face the threat of systemic subjectivism and researcher bias.
To validate the authenticity and internal consistency of qualitative phenomena, social scientists deploy methodological triangulation (see diagram in Figure 4 for an illustration of the use of primary methods in data gathering).

The concept functions similarly to spatial trilateration in global positioning systems (GPS), where a minimum of three distinct reference points are mathematically required to intersect and isolate a precise location.
In qualitative inquiry, relying on a single subjective narrative introduces a high probability of structural error. If a single source is inaccurate or biased, the analytical foundation suffers a 100% error rate.
Intersecting three or more distinct methodology streams or data sources establishes cross-verification, minimizing error margins and aligning the analytical output with empirical truth.
Primary Qualitative Triangulation Modalities
Graduate researchers often combine three key primary data collection methodologies to establish comprehensive triangulation:
- Household Interviews (HHI): Highly structured instruments administered via systematic sampling to household representatives. HHIs provide a macro-level approximation of population characteristics, though they remain vulnerable to response bias and the subjective honesty of the interviewee.
- Focus Group Discussions (FGD): Purposively assembled, multi-sectoral interactive panels that leverage group dynamics to observe social consensus, diverging community viewpoints, and shared cultural narratives.
- Key Informant Interviews (KII): Semi-structured, deep-dive qualitative sessions executed with purposively sampled community experts (e.g., institutional leaders, cultural elders, long-term residents). KIIs capture critical temporal context, historical community dynamics, and nuanced structural insights that macro-surveys miss.
Step 4: Institute quality control protocols for field personnel and enumerators
When primary data collection is outsourced to field enumerators or research assistants, establishing stringent quality control protocols is paramount.
Due to systemic pressures like daily completion quotas or fatigue, enumerators may execute data gathering in haste or deviate from established methodologies, introducing significant measurement artifacts.
Enumerator Deviations and Bias Catalysts
- Group Enumeration Dynamics: A frequent methodological violation involves interviewing multiple respondents simultaneously. This spatial configuration compromises response independence. Participants inevitably influence each other’s narratives, creating a clustering effect that skews both qualitative authenticity and quantitative variance.
- Fabrication and Imputation: Under pressure, enumerators may inadvertently omit survey items and subsequently self-impute missing values to present a complete questionnaire. This introduces artificial data points that corrupt the dataset’s integrity.
Empirical Field Verification Metrics
To systematically evaluate data collector fidelity, principal researchers should cross-examine field personnel using structured verification parameters:

- Temporal Audit: Was the interview duration mathematically sufficient for the instrument?
- Spatial Audit: Was isolation maintained, or were external peers present?
- Chain of Custody: Are start/end timestamps and geotagged field logs consistent?
Field Fraud and Bias Mitigation Strategies
- Temporal Logging: Require enumerators to record precise start and end times for every session to monitor administration velocity.
- Participant Attestation: Implement a post-interview sign-off protocol where the respondent signs the transcript or confirmation ledger immediately following the session.
- Photographic Verification: Deploy independent third-party monitoring or require timestamped, photographic evidence of active one-on-one engagements.
Step 5: Avoid the Wildfire Effect by mitigating information contagion
In social science field research, investigators must account for information contagion, colloquially termed the “wildfire effect.” This phenomenon occurs when information regarding the study’s specific inquiries diffuses rapidly through a community grapevine, altering the cognitive state of prospective respondents before they interact with the research instrument (Figure 5).

This contagion effect is highly pronounced when evaluating sensitive socio-legal issues, such as compliance with local resource ordinances (e.g. dynamite fishing, compressor diving) or regulatory frameworks. If local populations perceive the instrument as intrusive or incriminating, rumors will catalyze community-wide apprehension.

Methodological Remediation
- Temporal Clustering: To neutralize the wildfire effect, administer surveys and interviews within the shortest possible temporal window (e.g., executing all field instruments simultaneously within a single day per localized cluster).
- Minimizing Lag: Expanding data collection across multiple days within a tightly-knit community allows prospective respondents time to deliberate and align their answers, generating artificial consensus, strategic response bias, or outright refusals.
Conclusion
Adhering to these pre-analytical validation, triangulation, and field-monitoring protocols is essential for safeguarding data integrity. By systematically eliminating outliers, executing rigorous qualitative triangulation, enforcing enumerator accountability, and neutralizing information contagion, graduate researchers insulate their studies from systemic bias.
Ultimately, this structural rigor ensures that subsequent inferential statistics and qualitative syntheses yield valid, generalizable, and meaningful contributions to the broader body of knowledge.
Good statistical questions allow you to do the analysis of quantitatively gathered data. Check out our guide on How to Write Good Statistical Questions.

How to Write Good Statistical Questions
This guide on how to write good statistical questions will help you avoid data analysis problems once your data trickles in.
FAQ: Data Analysis: Five Essential Steps
Why is data quality important in data analysis?
Data quality is crucial because faulty data leads to inaccurate analysis results, summed up by the phrase “Garbage In, Garbage Out” (GIGO). Reliable data ensures accurate interpretations and conclusions.
What are the five data cleaning steps?
The steps are:
1. Detect and rectify statistical outliers
2. Systematically verify data accuracy and measurement fidelity
3. Methodologically triangulate qualitative data structures
4. Institute quality control protocols for field personnel and enumerators
5. Avoid the Wildfire Effect by mitigating information contagion
What is the significance of detecting outliers?
Detecting outliers helps verify if the data can be depended upon. Outliers might indicate errors or unusual data points, and checking them is essential to ensure accuracy.
How does triangulation improve data accuracy in qualitative research?
Triangulation applies multiple methods to verify data accuracy, reducing researcher bias and subjectivity, similar to how GPS uses satellites for precise location.
How can one verify the method of data collection?
Verify by questioning the data collectors about their process, ensuring they conducted systematic and unbiased interviews, and being cautious of any group interviews that might skew results.
What is the Wildfire Effect and how can it be avoided?
The Wildfire Effect refers to the spread of misinformation among respondents, leading to biased data. It can be avoided by administering surveys simultaneously to prevent gossip and influence.
© Simplyeducate.me | P. A. Regoniel