
Want to learn how to do regression analysis to turn raw numbers into reliable predictions? Mastering these steps will give you the framework to analyze data systematically, uncover hidden patterns, and forecast future trends with confidence.
This article breaks down the five essential steps you need to know—clear, practical, and ready to apply in your own research.
Table of Contents
What is regression analysis for?
Regression analysis is a statistical technique that is commonly used in various fields to analyze the relationship between two or more variables. It is a powerful tool that can help us understand how changes in one variable affect changes in another.
We can answer statistical research questions that relate to the relationship between variables that we have identified early in the study based on a set of research objectives. We want to know whether an outcome Y (e.g. waist-hip ratio), can be predicted by a set of X variables (e.g. age, meals taken per day, frequency of exercise).
Uses of Regression Analysis
Regression analysis is widely used in finance, economics, marketing, health, educational administration, and many other fields.
In finance, for example, regression analysis can predict stock prices or to analyze the relationship between a company’s earnings and its stock price. Thus, it can help investors choose their investment portfolios and avoid or reduce risks. Companies can figure out ways on how to gain profit with a better idea on how to price its stocks.
In economics, regression analysis is often used to estimate the effects of policy changes or to analyze the relationship between two economic variables.
As policy making is one of the key functions of governments, formulating policies would therefore be more data driven and much more accurate, instead of just a hit-and-miss approach which could prove to be costly for the people in general. Economic development can be achieved with more reliable models derived from regression analysis.
In education, multiple regression analysis can be used to identify academic and non-academic factors as predictors of early academic success in baccalaureate nursing programs. Thus, school administrators will be able to arm themselves with the knowledge gained in designing their admission policies as well as undertake curriculum development activities to increase student engagement and success in their academic life.
Is there only one type of regression analysis?
There are many types of regression analysis, but the most commonly used type is linear regression. Linear regression is a simple and easy-to-understand method that is suitable for many applications.
I will explain how linear regression works as an introduction to the many variations of this statistical technique in more detail in the next section.
Once you appreciate the importance and uses of linear regression, you can undertake more advanced study of the many types of regression analysis.
How does linear regression work?
The basic idea of linear regression is to find the line that best fits the data. This line is called the regression line, and it represents the relationship between the two variables being analyzed.
The regression line is determined by minimizing the sum of the squared differences between the predicted values and the actual values.
The equation for a simple linear regression model is:

where y is the dependent variable (the variable we are trying to predict), x is the independent variable (the variable we are using to make the prediction), β0 is the intercept (the point where the regression line crosses the y-axis), β1 is the slope (the change in y for each unit change in x), and ε is the error term (the difference between the predicted value and the actual value).

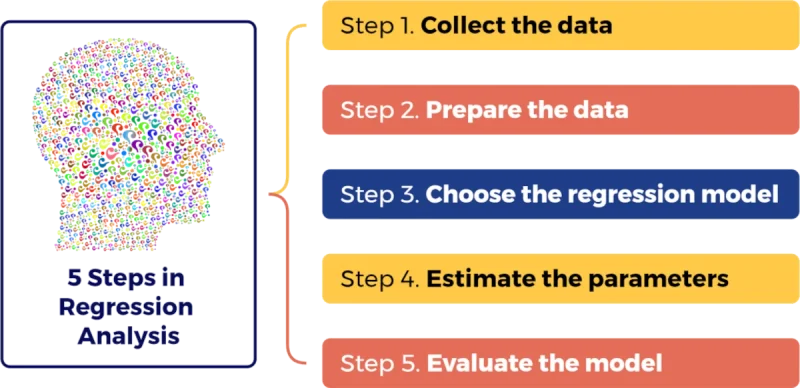
5 Steps in Regression Analysis
There are five steps involved in performing a regression analysis:
1. Collect the data
The first step is to collect the data that will be used in the analysis. The data should include values for both the dependent and independent variables determined by the researcher.
2. Prepare the data
The data may need to be cleaned and prepared for analysis. This may involve removing outliers, dealing with missing data, and transforming the data if necessary (see Data Cleaning Guide).
3. Choose the regression model
The next step is to choose the appropriate regression model. This will depend on the type of data being analyzed and the research question being asked.
4. Estimate the parameters
Once the model has been chosen, the next step is to estimate the parameters (i.e., the intercept and slope) of the regression line. Your chosen statistical software application such as SPSS, STATISTICA, or even Microsoft Excel with the statistics Analysis Toolpak add-in can do this for you.
5. Evaluate the model
The final step is to evaluate the model to determine how well it fits the data. This may involve calculating the coefficient of determination (R2), which measures the proportion of the variation in the dependent variable that the independent variable can explain. Just look for R2 in the statistical output of your statistical software application.
You may proceed to the next section to learn more about interpreting R-square in regression analysis output using Excel.
How to Do Regression Analysis in Excel?
Before you can do a regression analysis in Excel, you need to activate first the Analysis Toolpak add-in of Excel that ships with your copy of MS Excel. Later editions of Excel has changed a bit. But the idea is the same.
You just have to find the add-in by clicking on File–>Options (found on the lower left hand side of the display)–>Add-ins (look for Analysis ToolPak and highlight it)–>Manage: (find Excel Add-ins), then hit Go. Check the box of Analysis ToolPak and click OK. It’s now activated.
Now, you can use the data analysis function by Finding the Data tab in Excel. At the far right, you will see the Data Analysis button. Click on it and see a selection of common statistical tools.
Here is a simple video tutorial on how to activate it.
You can do both simple regression analysis and multiple regression analysis using Excel. A simple regression model consists of two groups of variables: one Y (dependent variable) and one X (independent variable). Multiple regression, on the other hand, consists of one Y (dependent variable) and more than one X (independent variables).
To analyze your data in Excel using simple regression analysis, do the following:
- Input your dependent variable in one column,
- Input your independent variable in the next column,
- Click on Analysis ToolPak, select Regression,
- Highlight the Independent Variable to enter them in the Regression input line labeled “Input Y Range”,
- Highlight the Dependent Variable to enter them in the Regression input line labeled “Input X Range”,
- Click Labels box if you included the first row as the Name of the Variable for that column (better include it so you will see the name in the output),
- Leave unchecked the Constant (default is zero) and Confidence Level (default is 95%),
- Click the radio button labelled Output Range,
- Select the cell where you want the results to display, and
- Click OK to get the results.
Here’s a simple video tutorial demonstrating how to do regression analysis using demo data. This video also includes a tip on interpreting the results by examining the relevant values.
I did a multiple regression analysis (many X variables) in my other post titled Multiple Regression Analysis Example with Conceptual Framework. You can see the practical application of multiple regression analysis in that article.
Four Applications of Regression Analysis
Regression analysis can be used for a wide range of applications, including:
- Predictive modeling: Regression analysis can be used to predict future values of the dependent variable based on changes in the independent variable.
- Causal analysis: Regression analysis can be used to determine whether changes in the independent variable cause changes in the dependent variable.
- Forecasting: Regression analysis can be used to forecast trends and patterns in the data, which can be useful for planning and decision-making.
- Control and optimization: Regression analysis can be used to optimize processes and control systems by identifying the factors that have the greatest impact on the outcome.
Summary
Regression analysis is a powerful statistical tool that can analyze the relationship between two or more variables. Linear regression is the most commonly used type of regression analysis, and we can use it for a wide range of applications, including predictive modeling, causal analysis, forecasting, and control and optimization.
By following the steps involved on how to use regression analysis, researchers can gain valuable insights into the relationships between variables and make informed decisions based on their findings.
Frequently Asked Questions (FAQ)
How to do regression analysis in Excel?
To perform a regression analysis in Excel, you first need to activate the Analysis ToolPak add-in via File > Options > Add-ins > Manage: Excel Add-ins (Go) and check the Analysis ToolPak box. Once activated, input your dependent variable in one column and your independent variable in the next, go to the Data tab, click on Data Analysis, select Regression, enter your Input Y and X ranges, and click OK.
How to do regression analysis in research?
Conducting regression analysis in research involves five essential steps:
Collect the data: Gather values for both your dependent and independent variables.
Prepare the data: Clean the dataset by removing outliers, handling missing data, and transforming values if necessary.
Choose the regression model: Select the appropriate model based on your research question and data type (such as simple linear regression or multiple regression).
Estimate the parameters: Use statistical software or tools (like SPSS, STATISTICA, or Excel’s Analysis ToolPak) to compute the intercept and slope of the regression line.
Evaluate the model: Assess how well the model fits the data by examining metrics like the coefficient of determination (R2).
How to interpret regression analysis?
You can interpret a regression model by looking at its parameters and statistical output. Specifically, you examine the intercept (β0) as the point where the line crosses the y-axis, the slope (β1) to understand the change in the dependent variable for each unit change in the independent variable, and the coefficient of determination (R2) to determine the proportion of variation in the dependent variable that can be explained by the independent variable.
© Simplyeducate.me | P. A. Regoniel