
Updated | January 11, 2026
Table of Contents
What are quantitative research methods? What is its definition, when are these research methods used, and what are its characteristics?
This article defines quantitative research methods and lists seven characteristics of quantitative research that discriminate these research methods from qualitative research approaches.
When to Use Quantitative or Qualitative Research
The methods used by researchers may either be quantitative or qualitative. The decision to select the method largely depends on the researcher’s judgment and the nature of the research topic. Some research topics are better studied using quantitative methods, while others are more appropriately explored using qualitative methods.
Read More: Qualitative Study Design: A Comprehensive Guide
Recently, many researchers use both methods, thereby the era of using mixed methods in research arose as a more desirable and encompassing approach to understanding phenomena. Qualitative methods may be used to explore a phenomenon and identify factors for a quantitative study. Or, a quantitative study may identify research areas that require the application of qualitative methods to provide an in-depth understanding of the phenomenon at hand or when the use of quantitative methods is insufficient to answer questions that relate to human behavior such as feelings, values, and beliefs.
J. Pizarro has already described qualitative research in this site, so this article focuses on quantitative methods, its meaning and characteristics.
What are quantitative research methods?
Quantitative research methods are those research methods that use numbers as its basis for making generalizations about a phenomenon. It emphasizes numerical data analysis using computational techniques like multiple regression analysis to analyze the relationship between multiple factors like age, sex, educational attainment, and academic performance.
The numbers used in statistical analysis originate from objective scales of measurement of the units of analysis called variables. Four types of measurement scale exist namely nominal, ordinal, ratio, and interval (see 4 Statistical Scales of Measurement).
The data that will serve as the basis for explaining a phenomenon, therefore, can be gathered through surveys. Such surveys use instruments that require numerical inputs or direct measurements of parameters that characterize the subject of investigation (e.g. pH, dissolved oxygen, salinity, turbidity, and conductivity to measure water quality).
These numbers will then be analyzed using the appropriate statistical application software to unravel significant relationships or differences between variables. The output serves as the basis for making the conclusions and generalizations of the study after a thorough discussion has been made.
Read more: How to write the results and discussion
7 Key Characteristics of Quantitative Research
Seven characteristics discriminate qualitative methods of research from qualitative ones. I enumerate the characteristics of quantitative research methods in the following list.
1. Contain Measurable Variables
Data gathering instruments contain items that solicit measurable characteristics of the population. These measurable characteristics are referred to as the variables of the study, such as age, the number of children, educational status, and economic status.

2. Use Standardized Research Instruments
The data collection instruments include questionnaires, polls, or surveys. Standardized, pre-tested instruments guide data collection, thus ensuring the accuracy, reliability and validity of data. Pre-testing helps identify areas in the research instruments that need revisions. It makes sure that respondents provide the expected answers or satisfy the intent of the researcher to meet the research objectives.
I illustrate these statements with specific examples in the following paragraphs.
A survey designed to assess student satisfaction in universities might include Likert scale questions such as “How satisfied are you with the quality of instruction?” with options ranging from “Very Satisfied” to “Very Dissatisfied.”
In a nationwide health study, researchers might use a pre-developed questionnaire from the World Health Organization (WHO) to ensure consistency across regions. This ensures that all data collectors follow the same script and response options, reducing variations caused by personal interpretation.
During a pilot test of a workplace stress questionnaire, several respondents misinterpreted the term “occupational hazard.” Based on this feedback, the researchers revised the item to “physical dangers related to your job (e.g., risk of injury, exposure to chemicals).”
Suppose a researcher is studying consumer attitudes toward eco-friendly products. A poorly worded item like “Do you care about the environment?” may yield vague responses. After pre-testing, the item could be improved to: “How often do you choose products with recyclable packaging?”—ensuring that answers align better with the research objective of measuring actionable behavior.
3. Assume a Normal Population Distribution
For more reliable statistical analysis in quantitative research, a normal distribution of the population data is generally preferred. A normal distribution—often illustrated by the classic “bell curve”—allows researchers to apply powerful statistical tests (such as t-tests and ANOVA) that assume the data is symmetrically distributed around a mean. This makes it easier to identify significant patterns, make predictions, and generalize findings to the broader population.
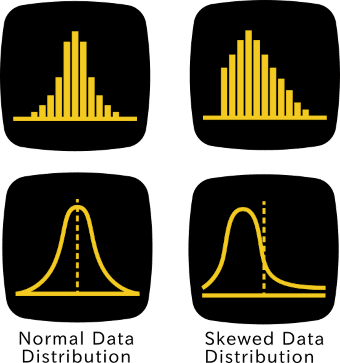
To achieve a distribution that approximates normality, researchers typically require a large sample size. The actual number of participants needed depends on the population’s variability: if the population is highly diverse in terms of the characteristic being measured (e.g., income, test scores, blood pressure), then a larger sample is needed to accurately reflect its distribution. For example, a study comparing average math test scores in different school districts would need a bigger sample if the schools differ widely in teaching methods and resources.
Furthermore, obtaining a reliable and unbiased sample demands strict adherence to the principle of random sampling. Random sampling ensures that every individual in the population has an equal chance of being selected. This minimizes the risk of researcher bias, which can occur when researchers intentionally or unintentionally select participants who support a certain hypothesis or exclude those who might disprove it. Bias of this kind undermines the integrity of the research and can lead to misleading conclusions that do not truly represent the broader population.
For instance, if a health researcher only surveys gym-goers to assess the average physical activity of a city’s population, the results will likely be skewed, as this group does not represent sedentary individuals. Randomly selecting individuals from various neighborhoods and age groups would yield more balanced and valid results.
4. Present Data in Tables, Graphs, or Figures
The data obtained using quantitative methods are organized using tables, graphs, or figures that merge large numbers of data to show trends, relationships, or differences among variables. This fosters understanding of the readers or clients of the research investigation.
5. Use Repeatable Method
Researchers can repeat the quantitative method to verify or confirm the findings in another setting. This reinforces the validity of groundbreaking discoveries or findings, thus eliminating the possibility of spurious or erroneous conclusions.
One of the major strengths of the quantitative research method is its ability to be replicated or repeated in different settings to verify or confirm findings. This replicability is essential for strengthening the validity and reliability of research results, particularly in studies that claim new or groundbreaking discoveries.
When other researchers apply the same method, use the same instruments, and analyze similar variables in a new context—such as a different location, demographic group, or time period—they can determine whether the original findings hold true. If similar results are obtained, it reinforces the conclusion that the original findings were not due to chance, bias, or a unique situation. This process is known as validation through replication.
For example, suppose a study concludes that a specific teaching method improves math scores among high school students in an urban school. If another group of researchers applies the same quantitative method in a rural school and finds similar improvements, it strengthens the claim that the teaching method is effective across different populations. On the other hand, if the results differ significantly, researchers may reevaluate the original study’s conclusions or explore new influencing variables.
Replication helps eliminate spurious relationships—that is, relationships that appear to exist due to uncontrolled variables or random chance. By demonstrating consistent patterns across multiple studies, researchers can build evidence-based theories that contribute to scientific knowledge and inform policy, practice, or innovation.
In fields like medicine, psychology, education, and the social sciences, replication is considered a cornerstone of credible research. Without it, findings remain untested hypotheses rather than validated truths.
6. Can Predict Outcomes
Quantitative models or formula derived from data analysis can predict outcomes. If-then scenarios can be constructed using complex mathematical computations with the aid of digital computers or computer-controlled robots commonly referred to as artificial intelligence or AI.
7. Use Calibrated Measuring Devices
Advanced digital or electronic instruments are used to measure or gather quantitative data from the field. The instruments ensure an objective and accurate collection of data provided that these are calibrated. Calibration means that the instruments used by the researcher matches the measurements of a reference instrument that is considered a standard.
The characteristics of quantitative research methods listed in this article make this research approach popular among researchers. Using qualitative research methods, however, is appropriate on issues or problems that need not require quantification or exploratory in nature.
What This eBook Will Help You Do
This condensed, 39-page mini eBook is a practical guide to help you:
- Learn quantitative data analysis in a few days, not one semester
- Distinguish the types of variables and data you’re dealing with
- Match your research questions with the appropriate statistical test
- Explain the results of statistical software applications
- Avoid common data collection mistakes that waste time and money
- Gain confidence in your data-driven conclusions

Reference
University of Southern California (2015). Quantitative methods. Retrieved on 3 January, 2015 from http://goo.gl/GMiwt
FAQ: Quantitative Research Methods: Meaning and Characteristics
Q1. What are quantitative research methods?
Quantitative research methods are research approaches that use numbers as the basis for making generalizations about a phenomenon. They emphasize numerical data analysis using computational techniques like multiple regression analysis to examine relationships between multiple factors such as age, sex, educational attainment, and academic performance.
Q2. When should I use quantitative research instead of qualitative research?
The decision depends on your research topic and objectives. Quantitative methods are best when you need to measure variables, test hypotheses, or make statistical generalizations about a population.
Qualitative methods are more appropriate for exploring phenomena in-depth or understanding human behaviors like feelings, values, and beliefs.
Many researchers now use mixed methods, combining both approaches for a more comprehensive understanding.
Q3. What are the seven key characteristics of quantitative research?
The seven characteristics are: (1) Contains measurable variables, (2) Uses standardized research instruments, (3) Assumes a normal population distribution, (4) Presents data in tables, graphs, or figures, (5) Uses repeatable methods, (6) Can predict outcomes, and (7) Uses calibrated measuring devices.
Q4. Why is normal distribution important in quantitative research?
A normal distribution allows researchers to apply powerful statistical tests like t-tests and ANOVA that assume data is symmetrically distributed around a mean. This makes it easier to identify significant patterns, make predictions, and generalize findings to the broader population.
Q5. What are standardized research instruments?
Standardized research instruments are pre-tested data collection tools like questionnaires, polls, or surveys that guide data collection to ensure accuracy, reliability, and validity. Pre-testing helps identify areas needing revision and ensures respondents provide expected answers that meet research objectives.
Q6. How does random sampling prevent bias in quantitative research?
Random sampling ensures every individual in the population has an equal chance of being selected, minimizing researcher bias. This prevents researchers from intentionally or unintentionally selecting participants who support a certain hypothesis or excluding those who might disprove it, leading to more valid and representative results.
Q7. Why is replication important in quantitative research?
Replication allows other researchers to verify or confirm findings in different settings, strengthening the validity and reliability of results. When similar results are obtained across multiple studies, it reinforces that findings weren’t due to chance, bias, or unique situations, helping eliminate spurious relationships and build evidence-based theories.
Q8. What does it mean that quantitative research can predict outcomes?
Quantitative models or formulas derived from data analysis can predict future outcomes through if-then scenarios constructed using complex mathematical computations. This predictive capability is increasingly enhanced by digital computers and artificial intelligence.
Q9. What are the four types of measurement scales used in quantitative research?
The four types of measurement scales are nominal, ordinal, ratio, and interval. These scales are used to objectively measure the units of analysis called variables, and the numbers generated serve as the basis for statistical analysis.
Q10. What does calibration mean for measuring devices in quantitative research?
Calibration ensures that the instruments used by researchers match the measurements of a reference instrument considered a standard. This guarantees objective and accurate data collection from the field when using advanced digital or electronic instruments.
© Simplyeducate.me | P. A. Regoniel
very concise and helpful
Very good article and helpful
Professional findinds
Thank you Gagi. I’m glad this article helped you.
THANK YOU. THE ARTICLE APPEARS SMALL BUT IT IS ACTUALLY VERY HELPFUL. I JUST MANAGED TO ANSWER QUESTIONS FOR MY ASSIGNMENT. THANK YOUUUUU.
Welcome Xolani. That’s great to know.
Nice material thank you.
Insightful. Thank you.
Welcome Romanus. It’s great to know you find it useful.
Wished I have seen your article before. I’m doing my undergrad thesis right now and I’m struggling on what are the important aspects should be considered in writing a thesis especially this quantitative method. This is indeed what I’m looking for. Though I’m a little late. Great explanation! Thank you very much!
I’m happy to hear that Jed. Glad this site helped you. Take care…
I USED IT TO COMPLETE MY THESIS IT WAS REALLY HELPFUL THANK YOU (*-*)
Great to know that Zehtu. Keep it up!
Great help
Thanks for the article.It really helped me on my assignment.
A very good work.
It is very useful. Thanks so much
This is amazing, finally I learnt some useful information and it’s easy for me to finish my assignment.
This is very helpful especially the reference
concise and written in a simple language that helps research beginners like me. Thanks for that short but master piece
Wonderful information, helped me to do my assignment
work is now simple here because of the preciseness
Very helpful. Thank you.
It’s a masterpiece, very helpful.